
Figure 1. Manhattan plots for GWAS results.
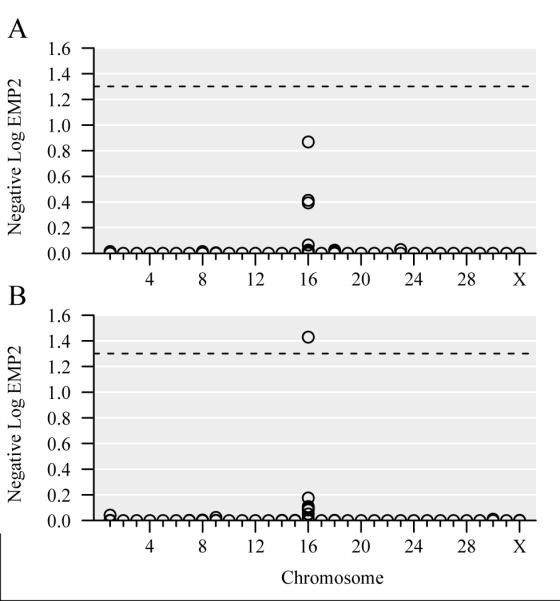
Both panels display GWAS results from additive logistic regression tests with 10,000 permutations. Sex was used as a covariate in panel A, and sex and racing history were used as covariates in panel B. Each SNP is denoted by a circular point on the plot, and SNPs with the same p-value overlap. The horizontal axis indicates chromosomes 1-31 and X, and the vertical axis shows negative log EMP2 values. A dashed line is drawn where p-value=0.05 (negative log EMP2 = 1.3).