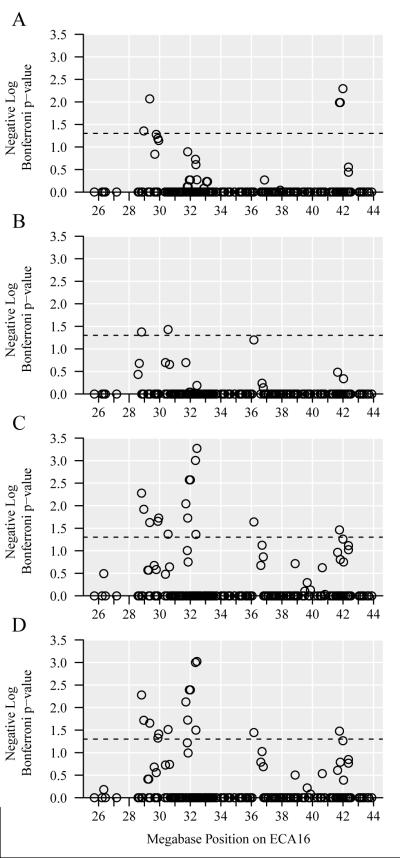
Figure 2. Manhattan plots for ECA16 fine-mapping SNPs with sex as a covariate.
All panels show results for 247 SNPs after additive logistic regression tests with sex a covariate and Bonferroni correction. Circular points represent SNPs, ECA16 Mb positions are on the horizontal axis, negative log p-values are on the vertical axis, and the dashed line represents p-value=0.05 (negative log p-value=1.3). Panel A shows population one (n = 85 horses), panel B shows population two (n = 132 horses), panel C shows both populations (n = 217 horses), and panel D shows both populations in a mixed model using a relationship matrix derived from pedigrees (n = 217 horses).

