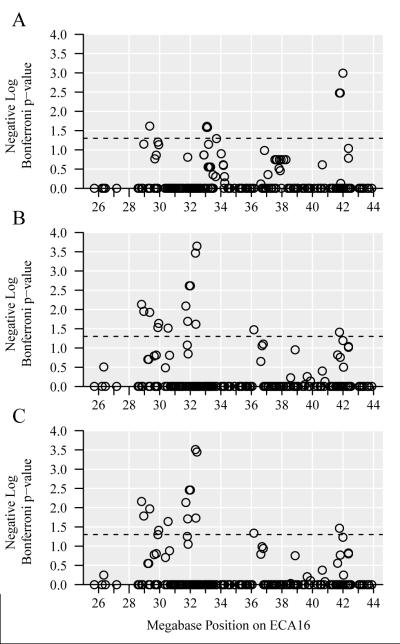
Figure 3. Manhattan plots for ECA16 fine-mapping SNPs with sex and racing history as covariates.
All panels show results for 247 SNPs after additive logistic regression tests with sex and racing history as covariates and Bonferroni correction. Circular points represent SNPs, ECA16 Mb positions are on the horizontal axis, negative log p-values are on the vertical axis, and the dashed line represents p-value=0.05 (negative log p-value=1.3). All of the controls in population two were raced, so race was not needed as a covariate when population two was analyzed alone. Panel A shows population one (n = 85 horses), panel B shows both populations (n = 217 horses), and panel C shows both populations in a mixed model using a relationship matrix derived from pedigrees (n = 217 horses).

