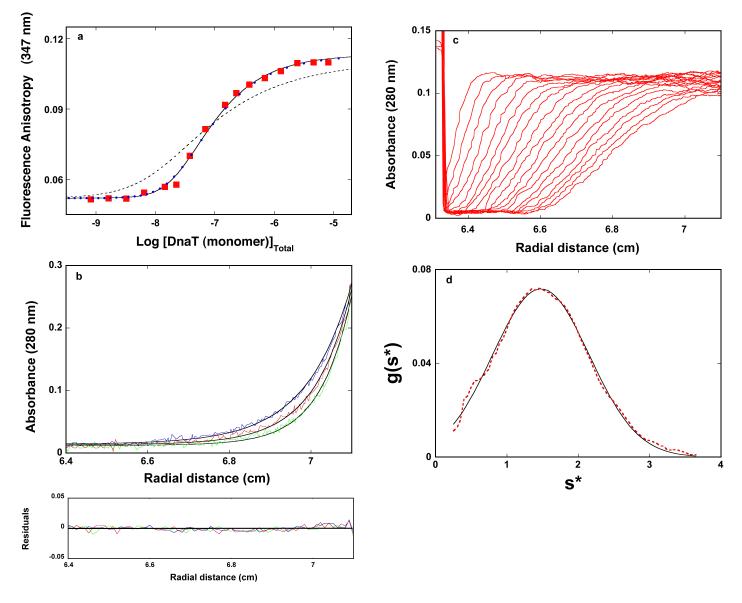
Figure 1.
a. The dependence of the DnaT fluorescence anisotropy upon the total DnaT monomer concentration (λex = 296 nm, λem = 347 nm) in buffer C (pH 7.0, 20°C), containing 0.1 mM EDTA and no magnesium (Materials and Methods). The solid line is the nonlinear least-squares fit of the titration curve, using the trimer model described by eqs. 3 - 7 (accompanying paper), with KT = 1.8 × 10¹⁴ M−2, rM = 0.0520, and rT = 0.1133. The dashed line is the best fit of the titration curve using the monomer <-> dimer <-> trimer model described by eqs. 8 - 13 (accompanying paper), with KM = 1.6 × 10⁷ M−1, rM = 0.0520, rD = 0.080, and rT = 0.1133. The symbols  represent the nonlinear least squares fit of the titration curve using the cooperative monomer<-> dimer <-> trimer model (eq. 21a, accompanying paper), with KM = 5 × 10⁵ M−1, σ = 750 ± 100, rM = 0.0520, rD = 0.080, and rT = 0.1133. b. Sedimentation equilibrium concentration profiles of the DnaT protein in the same buffer conditions without magnesium. The concentration of the protein is 2.86 × 10⁻⁶ M (monomer). The profiles have been recorded at 280 nm and at 14000 (blue), 16000 (red), and 18000 (green) rpm. The solid lines are nonlinear least-squares fits to a single exponential function (accompanying paper, eq. 2), with a single species having a molecular weight of 62,000 ± 4,000 (Materials and Methods). Lower panel shows the residuals of the fits. c. Sedimentation velocity absorption profiles at 280 nm of the DnaT protein in buffer C (pH 7.0, 25°C), containing 0.1 mM EDTA and no magnesium. The concentration of the DnaT is 4.29 × 10⁻⁶ M (monomer); 50000 rpm. d. Apparent sedimentation coefficient distribution, g(s*), as a function of the radial sedimentation coefficient coordinate, s*, obtained from the time derivatives of the DnaT protein sedimentation profiles in panel c. The solid line is the nonlinear least-squares fit of the distribution using the software provided by the manufacture (Materials and Methods).

