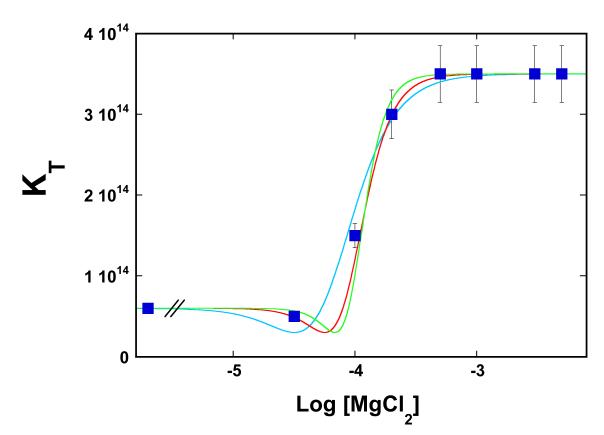
Figure 3.
The dependence of the DnaT trimerization constant, KT, upon the logarithm of MgCl2 concentration in solution, in buffer C (pH 7.0, 35°C). The solid red line is the nonlinear least-squares fit of the plot to eq. 6 with n = 3 and Kn = 2.3 × 10¹² M−3. For comparison, the best fits using n = 2 (turquoise) and n = 4 (green) are also included.

