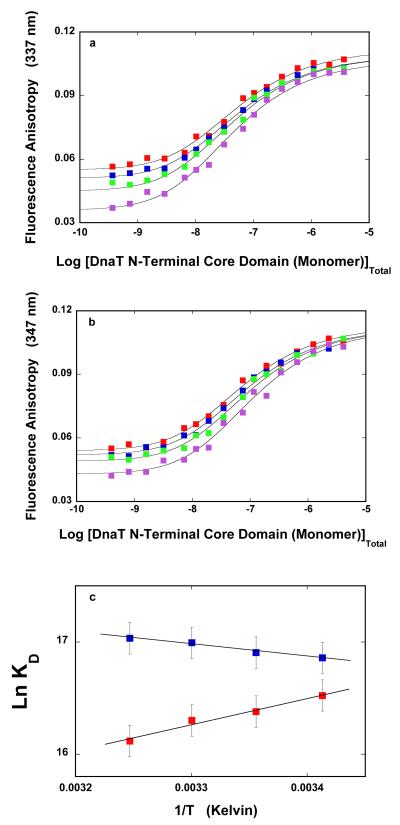
Figure 7.
a. The dependence of the fluorescence anisotropy of the DnaT N-terminal core domain upon the total domain monomer concentration (λex = 296 nm, λem = 347 nm) in buffer C (pH 7.0), recorded at different temperature:  20°C,
20°C,  25°C,
25°C,  30°C, and
  35°C. The solid lines are the nonlinear least-squares fits of the titration curves, using the trimer model described by eqs. 3 - 7 (accompanying paper). b. The dependence of the DnaT fluorescence anisotropy upon the total DnaT monomer concentration (λex = 295 nm, λem = 347 nm) in buffer C (pH 7.0), containing 0.1 mM EDTA and no magnesium, recorded at different temperature:
  20°C,
20°C,  25°C,
25°C,  30°C, and
  35°C. The solid lines are the nonlinear least-squares fits of the titration curves, using the trimer model (accompanying paper, eqs. 3 - 7). c. The dependences of the trimerization constant, KT, upon the reciprocal of the temperature (Kelvin) (van’t Hoff plot), in the presence
  and absence
  of magnesium, respectively. The solid lines are linear least-squares fits to the van’t Hoff equation (details in text).

