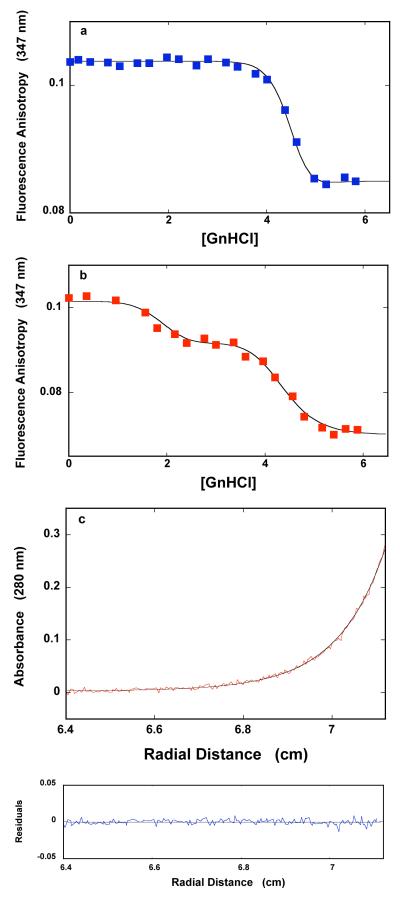
Figure 8.
a. The dependence of the fluorescence anisotropy of the DnaT N-terminal core domain (1.18 × 10⁻⁶ M (monomer)) upon the concentration of GnHCl in buffer C (pH 7.0, 25°C). The solid line is the nonlinear least-squares fit of the experimental titration curve to eqs. 7 - 14, with, p = 16 and KG = 1.7 × 10⁻¹⁰ M−16 rMF = 0.055, rMG = 0.085, and rD = 0.113. b. The dependence of the fluorescence anisotropy of the DnaT protein (1.18 × 10⁻⁶ M (monomer)) upon the concentration of GnHCl in buffer C (pH 7.0, 25°C), containing 0.1 mM EDTA and no magnesium. The smooth solid line is the nonlinear least-squares fit of the experimental titration curve to eqs. 21 - 25, with m = 5, q = 12, with KM = 1.1 × 10⁻¹ M−1, KQ = 2.1 × 10⁻⁸ M−12, rMF = 0.054, rMM = 0.0925, rMQ = 0.070, and rD = 0.1133 (details in text). c. Sedimentation equilibrium concentration profiles of the DnaT N-terminal core domain in buffer C (pH 7.0, 25°C), containing 0.1 mM EDTA and no magnesium, and 3.36 M GnHCl. The concentration of the protein is 3.25 × 10⁻⁶ M (monomer). The profile has been recorded at 280 nm and at 27000 rpm. The smooth solid line is the nonlinear least-squares fit to a single exponential function (accompanying paper, eq. 2), with a single species having a molecular weight of 16,467 (Materials and Methods). Lower panel shows the residuals of the fit.

