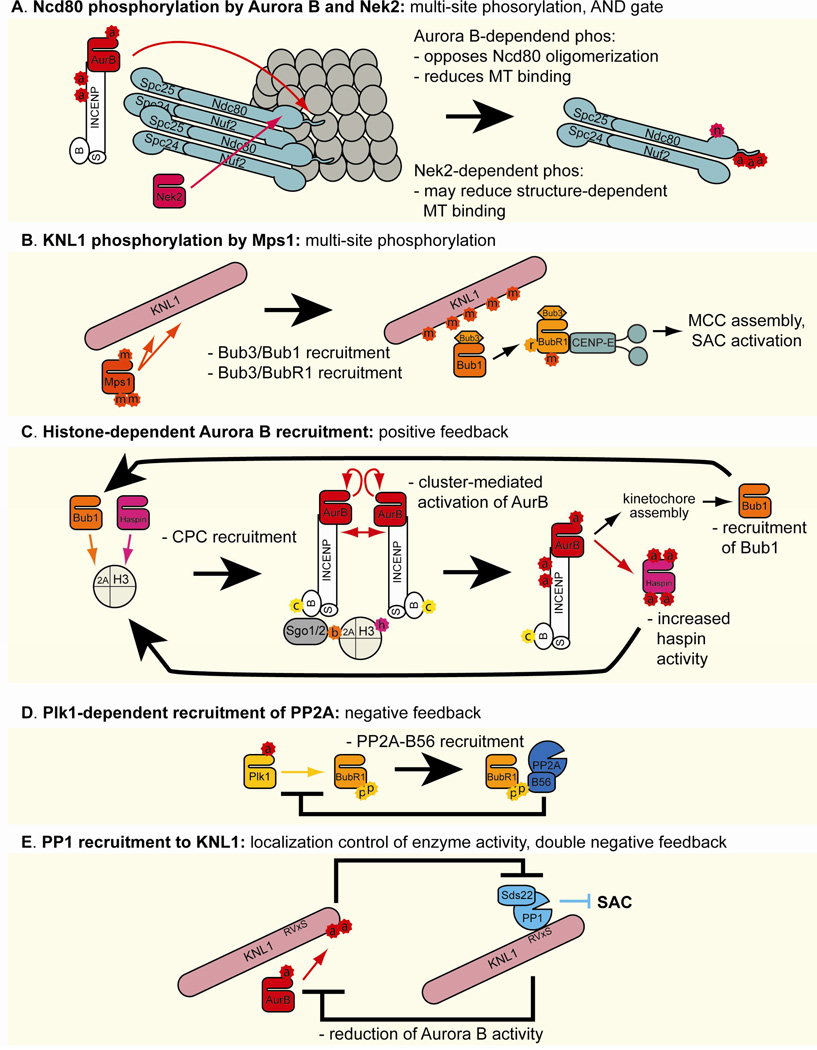
Figure 4. Phospho-regulation of kinetochore functions.
Schematic illustrations of kinase and phosphatase signaling networks controlling kinetochore function. Colored arrows and inhibition symbols show the activity of kinases and phosphatases of the corresponding color. Large black arrows and inhibition symbols denote the functional consequences and feedback loops generated by this phospho-signaling, with small black arrows representing subprocesses within each signaling network.

