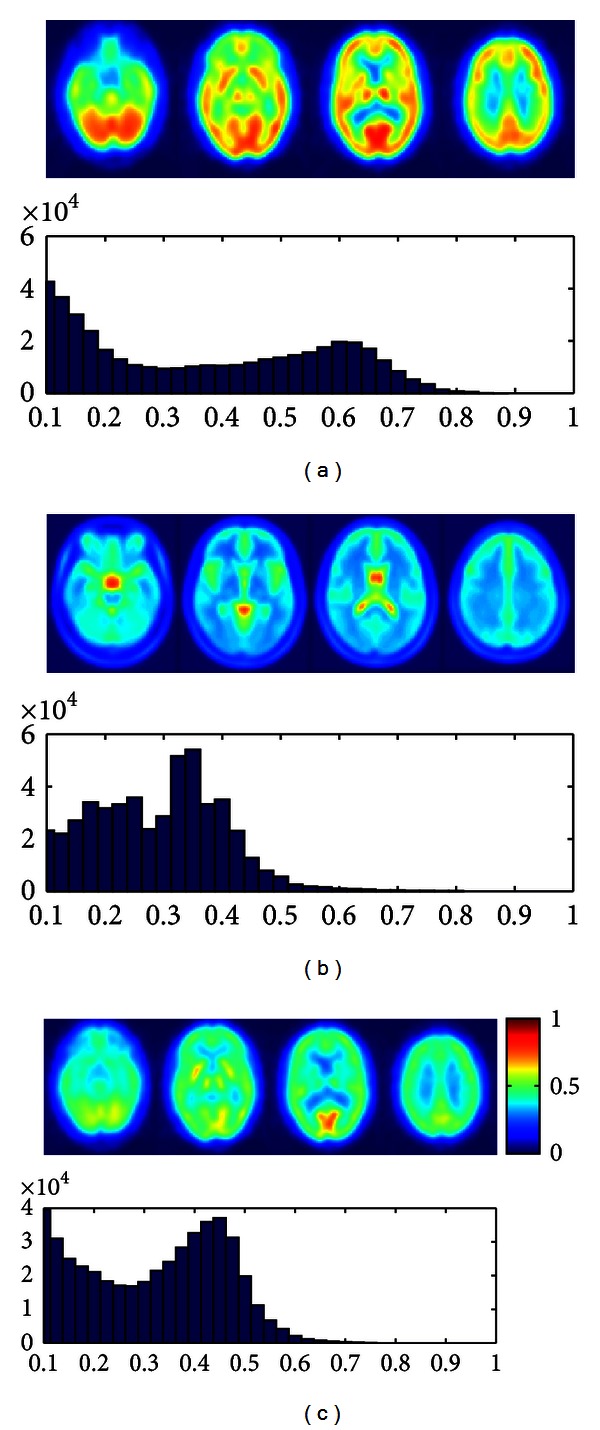
Figure 6.

(a) Four transaxial slices of mean of 50 original SPECT images and its histogram of intensity values. (b) Four transaxial cuts of the reference template and the histogram of intensity values. (c) Four transaxial slices of mean of 50 preprocessed SPECT images using histogram matching.
