Figure 3.

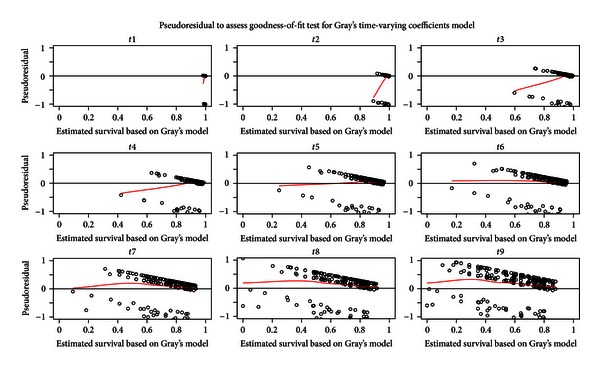
Goodness-of-fit test for Gray PC-TVC model using pseudoresiduals (dotted points) and lowess smoothed curves (red solid lines) against the estimated survival rates at each of the preselected time points.

Goodness-of-fit test for Gray PC-TVC model using pseudoresiduals (dotted points) and lowess smoothed curves (red solid lines) against the estimated survival rates at each of the preselected time points.