
Figure 4.
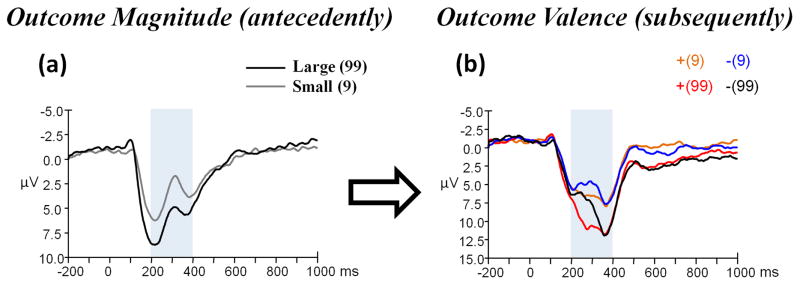
(a) Grand-average ERPs evoked by outcome magnitude (presented antecedently) at the Fz recording site, and (b) that evoked by outcome valence (presented subsequently) at the FCz recording site using a 0.05 – 30 Hz band-pass filter. The time point “0” indicates the outcome presentation onset. The light gray shaded areas indicate the 200–400 ms time window for the detection of the most negative peak. The scalp topographies of each condition are presented beneath.