
Figure 4.
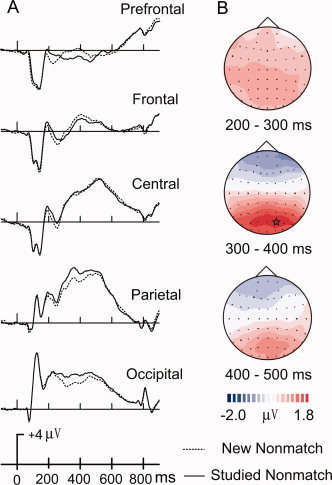
(A) ERP comparisons between new nonmatches and studied nonmatches across five midline scalp locations (FPz, Fz, Cz, Pz, Oz). Topographic maps (B) illustrate ERP difference waves computed by subtracting ERPs to studied nonmatches from ERPs to new nonmatches across three intervals (200–300, 300–400). The largest activation difference is indicated by a star.