
Figure 5.
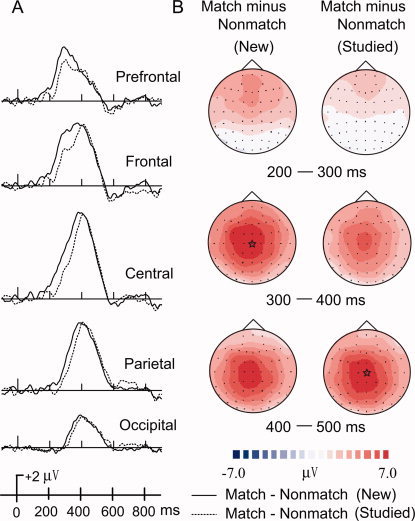
ERPs comparisons between WM for new matches and WM for studied matches are shown from (A) five midline scalp locations (Fpz, Fz, Cz, Pz, Oz). WM difference waves were computed by subtracting ERPs to nonmatches from matches for both old and new objects. Topographic maps (B) illustrate WM difference waves across three intervals (200–300, 300–400). The largest activation differences are indicated by stars.