
Figure 2. Relative changes in coronary artery area, peak diastolic coronary flow velocity and blood-flow during isometric handgrip stress and mean coronary wall thickness.
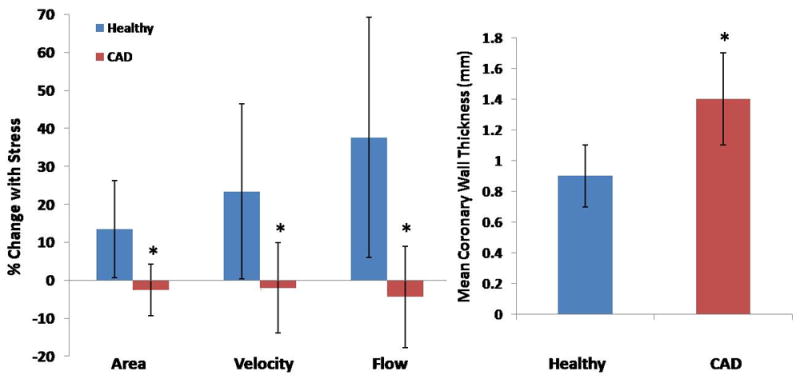
(A) Relative changes in coronary vasoreactive parameters with stress for healthy subjects (blue bars, n=17 arteries studied in 14 subjects) and patients with CAD (red bars, n=17 arteries in 14 subjects). Bars indicate standard deviations. (B) Average coronary wall thickness (mm) for healthy individuals and CAD patients (* p<0.0001 vs. healthy).