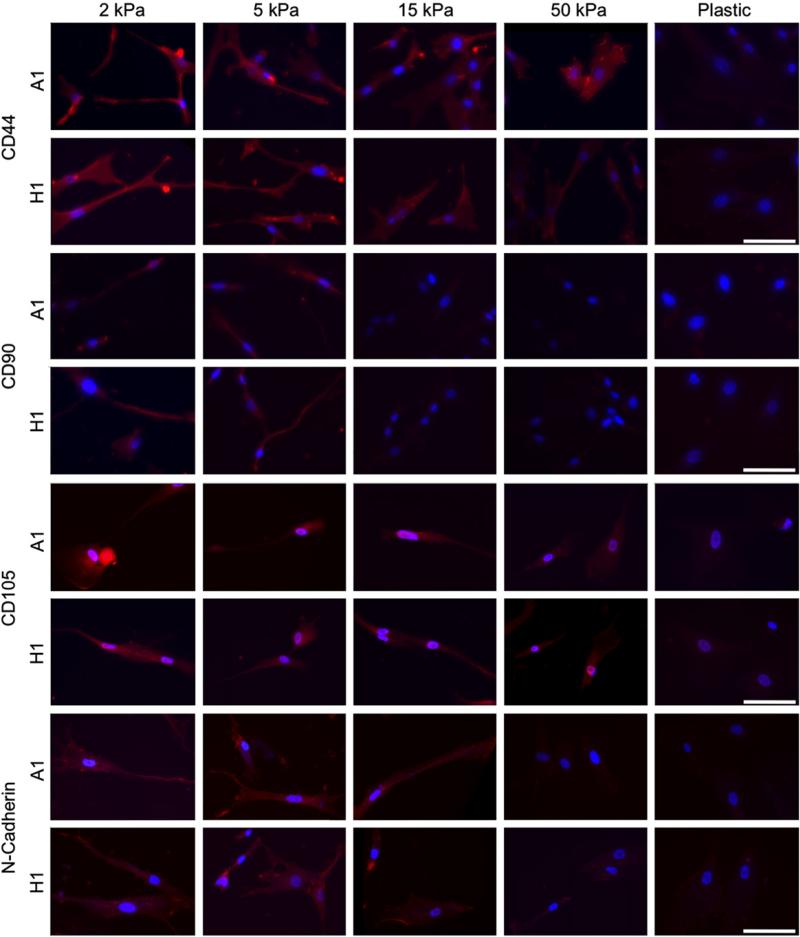
Fig. 5.
Immunofluorescence shows increases in CD44, CD90, CD105, and N-cadherin expression in both A1 and H1 clones as substrate E′ decreases. Red—CD44, CD90, CD105, or N-cadherin as indicated; Blue—DAPI; Scale bar: 50 μm. (For interpretation of the references to color in this figure legend, the reader is referred to the web version of this article.)

