
Fig. 4.
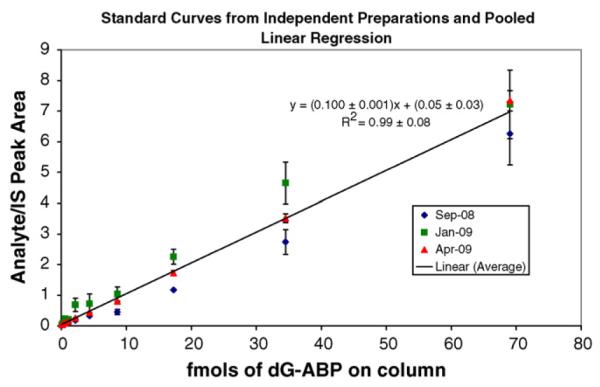
Standard curve. dG-C8-4-ABP calibration curves of fmol analyte on column versus the ratio of analyte to internal standard peak areas were generated in triplicate over an 8-month period. Every point from each calibration curve was also analyzed in triplicate. The linear regression line incorporates all three curves and has a slope of 0.100±0.001, a y-intercept of 0.05±0.03, and a correlation coefficient R2 of 0.99±0.08.