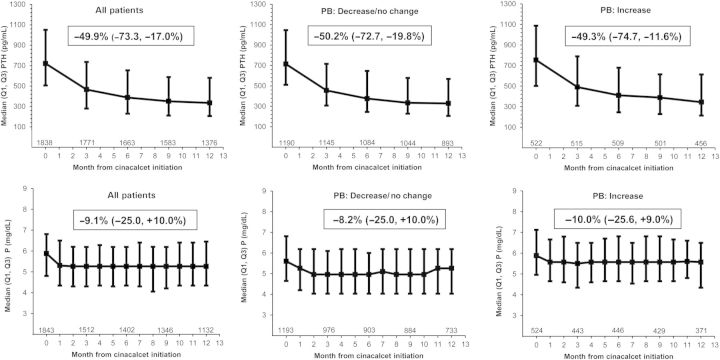
Fig. 2.
Evolution of serum PTH and phosphorus, overall and by PB change category. For each timepoint, values are shown for all patients with available data. The box within each graph shows the median (Q1, Q3) individual change from baseline (cinacalcet start) to Month 12 (patients with baseline and Month 12 values only, thus patient numbers differ slightly from the graphs).

