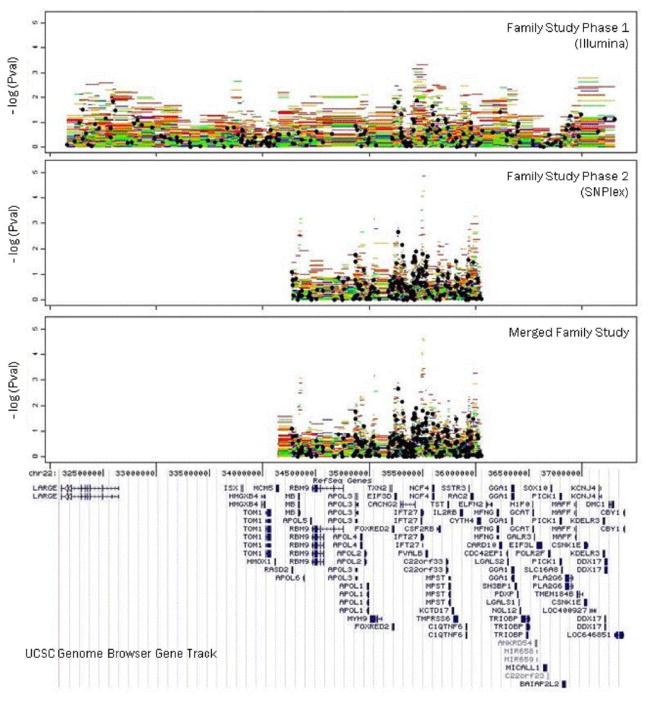
FIG. 1. TDT analysis of family study phases.
The top three panels illustrate the significance of single SNP and haplotype analysis as –log(P) for the two independent family samples and their merged results. Black circles denote the single SNP analyses. The haplotypes are colored by number of SNPs used in the window (5 SNPs—red, 4 SNPs—orange, 3SNPs—green, 2SNPs—blue). UCSC genome browser gene track is provided for reference.
The NCBI 36 map is used for positions.

