
Fig. 2. Association analysis of the case control replication sample.
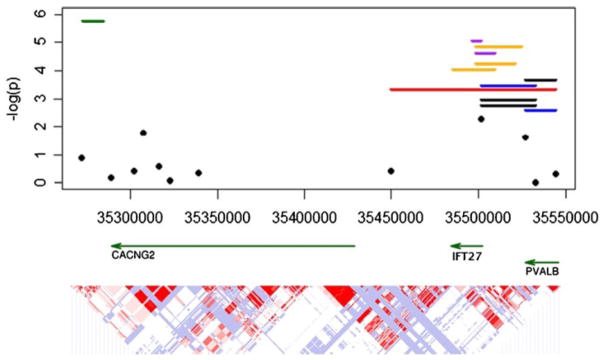
Significance levels as −log(P) of the 12 SNPs genotyped in the case control replication sample are illustrated as black circles. Black lines denote the significant individual haplotype window incorporating all haplotypes in the window. The significant haplotypes from the three family sample analyses are also illustrated here for comparison: family study phase 1 is red, family study phase 2 is orange, the merged family sample is purple. The most significant haplotype from the LAMP analysis is illustrated in green. Gene locations and the LD structure in the HapMap Caucasian sample are below for reference.
Positions are based on the NCBI 36 map.