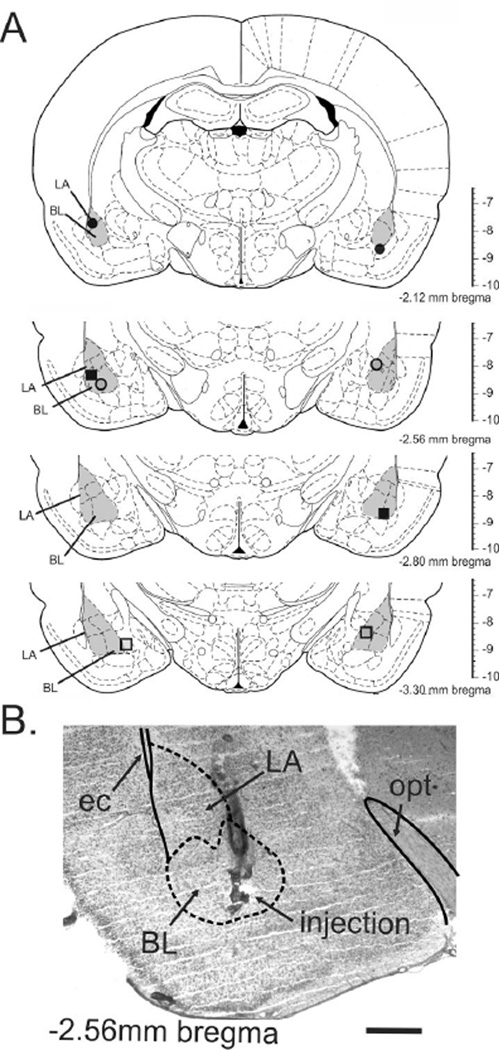
Figure 1.
a) Schematic representation of the bilateral injection sites as determined by histology. Infusion cannulae placements are illustrated as symbols, where same symbols represent the bilateral injections for that individual rat. Illustrations of coronal brain sections are based on the rat brain atlas of Paxinos and Watson (1986). Numbers to bottom right of each section indicate the distance posterior from bregma; the vertical scale on the right of each section represents the distance ventral from bregma (in mm). b) Photomicrograph illustrates an example of histological verification of the injector tip placements for microinjections targeting the BL. The photomicrograph shows the injection site on the left side of a single rat through the basolateral amygdala (BLA: which is made up of the lateral amygdaloid nucleus (LA) and basolateral amygdaloid nucleus (BL)) at approximately –2.56 mm bregma. Solid lines represent white matter tracts and dashed lines illustrate subdivisions of the BLA. Abbreviations: BL, basolateral amygdaloid nucleus; ec, external capsule; LA, lateral amygdaloid nucleus; opt, optic tract. Scale bar = 800 µm.

