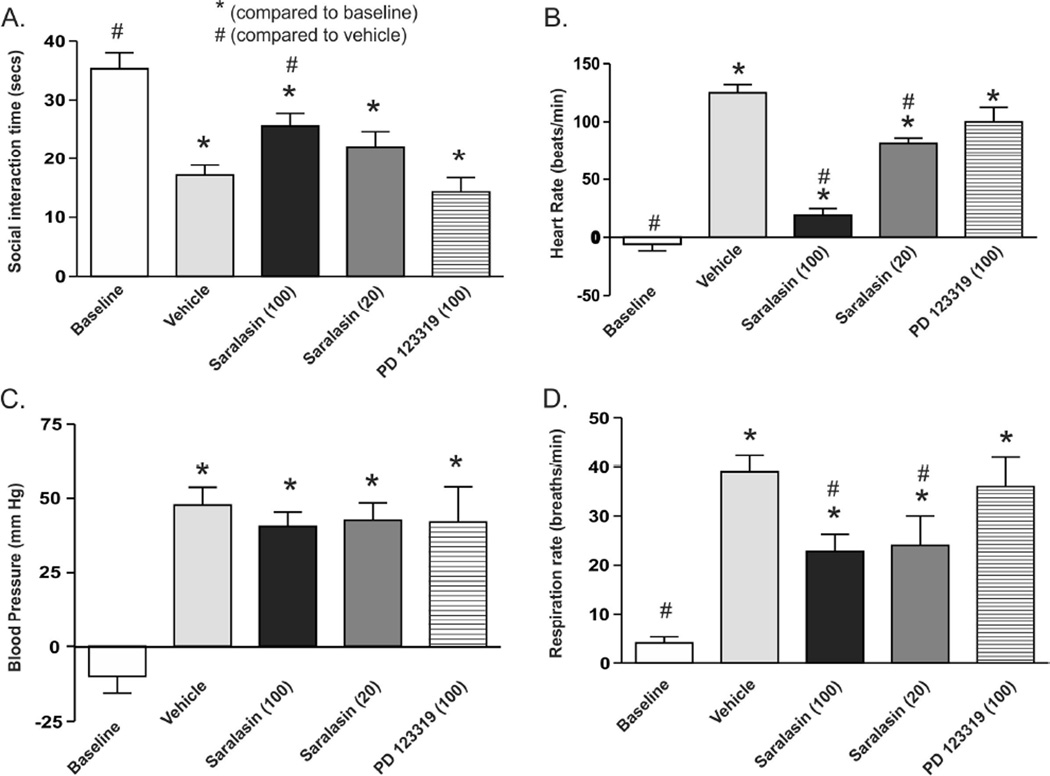
Figure 2.
Bar graphs illustrate A) social interaction (SI) time, B) heart rate (HR), C) mean arterial blood pressure (MAP) and D) respiration rate (RR) for each treatment group. Baseline bars represent reactivity (change in HR, MAP and RR following i.v. sodium lactate (NaLac) infusions in cannulated rats prior to urocortin 1 (UCN)/basolateral amygdala (BLA) priming. Five days following onset of UCN/BLA priming (in a counter-balanced design) rats randomly received 100 nl injection of saline vehicle, 20 pmoles or 100 pmoles saralasin (a nonselective A-II receptor antagonist), or 100 pmoles of PD123319 (a selective A-II type 2 receptor antagonist), bilaterally into the BLA 30 min prior to NaLac challenge. Data are presented as means ± SEM. * and #, respectively, represent significant difference from baseline or vehicle groups p < 0.05 (ANOVA with Newman-Keuls post hoc test).

