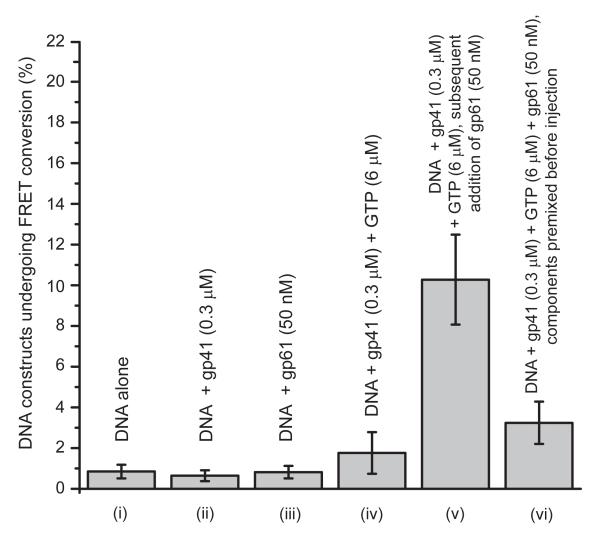
Figure 3. Percentage of DNA constructs that undergo one or more FRET conversion events per imaging area within 120 seconds as a function of protein components and GTP ligands present and their concentrations.
The bar heights represent the percentage of DNA constructs that have undergone one or more FRET conversion events per imaging area in 120 sec. The structure of the DNA construct is shown in Fig. 1a (and the DNA sequence in the SI text). n corresponds to the number of independent experiments of each type conducted, and N to the total detected number of FRET pairs in the multiple image areas analyzed (n). (i) surface immobilized DNA replication fork constructs (rfDNA) without helicase (n = 5, N = 2849); (ii) rfDNA + gp41 (0.3 JM) (n = 3, N = 3162); (iii) rfDNA + gp61 (50 nM) (n = 3, N = 1107); (iv) rfDNA + gp41 (0.3 JM) + GTP (6 JM) (n = 5, N = 3162); (v) rfDNA + gp41 (0.3 JM) + GTP (6 JM) + gp61 (50 nM) (n = 7, N = 4416); (vi) rfDNA + premixed gp41 (0.3 JM) + GTP (6 JM) + gp61 (50 nM) (n = 8, N = 4401). All measurements were performed in the presence of 6 μM GTP.

