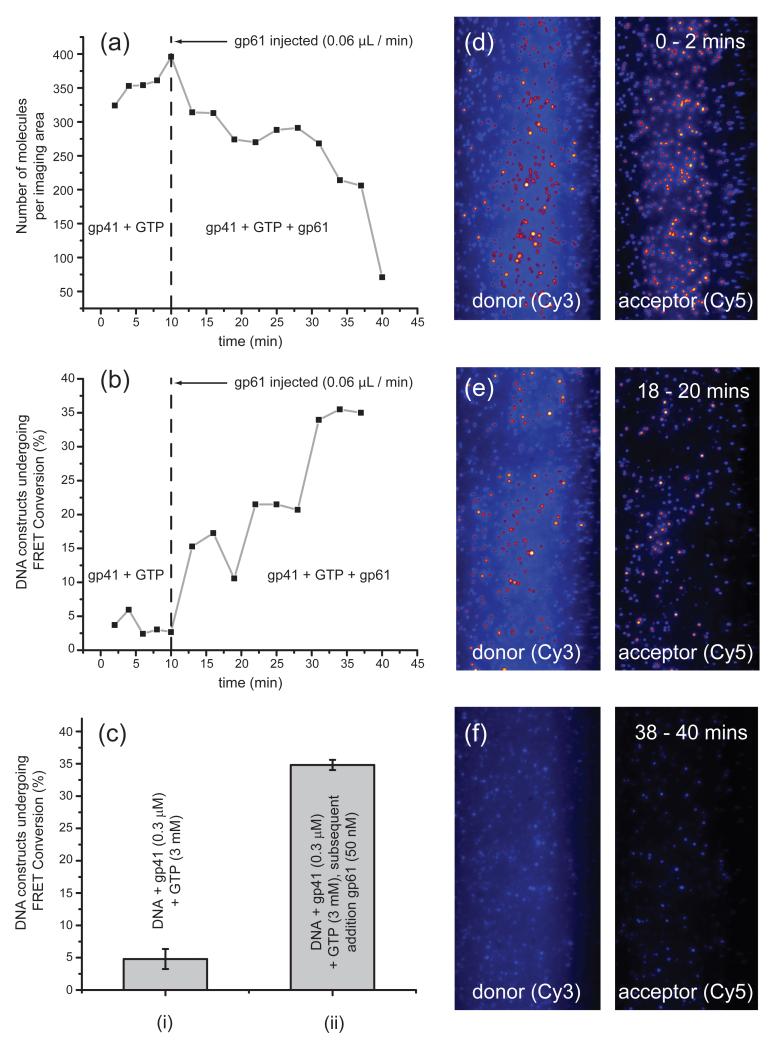
Figure 5. ‘Timed-release’ experiments.
A 50 nM solution of gp61 was injected into a sample chamber containing 0.3 JM gp41 and 3 mM GTP. (a) Plot of the number of DNA constructs detected within the imaging area as a function of time before and after the slow introduction of gp61 using a syringe pump (0.06 JL min−1); and (b) percentage of DNA constructs that undergo one or more FRET conversion event(s) per imaging area within 120 seconds as a function of time before and after the slow introduction of gp61. The vertical line at 10 minutes indicates the time at which sample injection was initiated. (c) GTP concentration-dependent unwinding activity of helicase and helicase-primase plotted as a percentage of DNA constructs that undergo one or more FRET conversion event(s) per imaging area within 120 seconds as a function of time before and after the slow introduction of gp61. The bar graph shows the percentage of observed FRET conversion events under different sample conditions using the surface immobilized DNA replication fork (rfDNA): (i) rfDNA + gp41 (0.3 JM) + GTP (3 mM) (n = 4; N = 1224); and (ii) rfDNA + gp41 (0.3 JM) + GTP (3 mM) + gp61 (50 nM) (n = 3; N = 979). (d) A representative single molecule image obtained during the 0 to 2 min data acquisition period in panels (a) and (b). (e) Same as (d), but during the 18 to 20 min interval. (f) Same as (d), but during the 38 to 40 min interval. The image scales are the same as those in Fig. 4.

