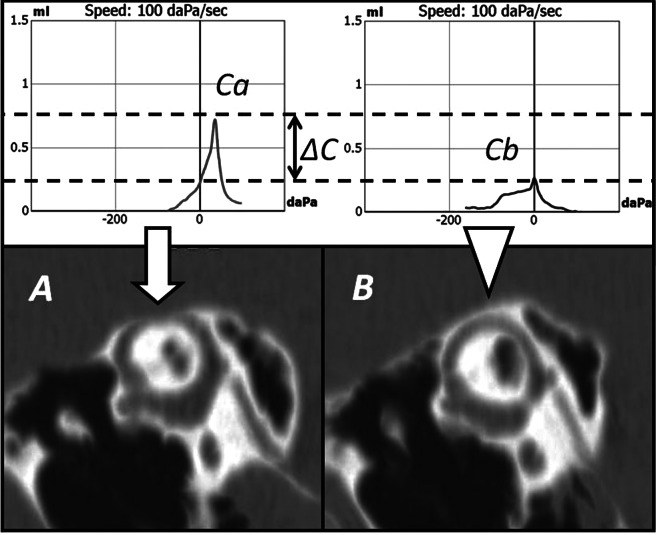
Fig. 1.
The upper image shows tympanometric peak compliance measurements of the right dehiscent ear (Ca) and the left healthy ear (Cb) corresponding to impedancemetric data of the patient n. 25 from the study group. Two parallel dotted lines indicate the levels corresponding to the peak compliances of the two sides (0.73 ml for the right side and 0.27 ml for the left side). The distance between the two dotted lines indicates the inter-aural difference (ΔC) in tympanometric peak compliance (0.46 ml in this case). The lower images represent the HRCT reformatted scans aligning with the plane of the SSC (Pöschl plane) of the same patient. Fig. 1A represents the right affected superior canal (dehiscence indicated by the arrow). Fig. 1B represents the left superior canal (intact bony roof indicated by the arrowhead).

