Figure 3.
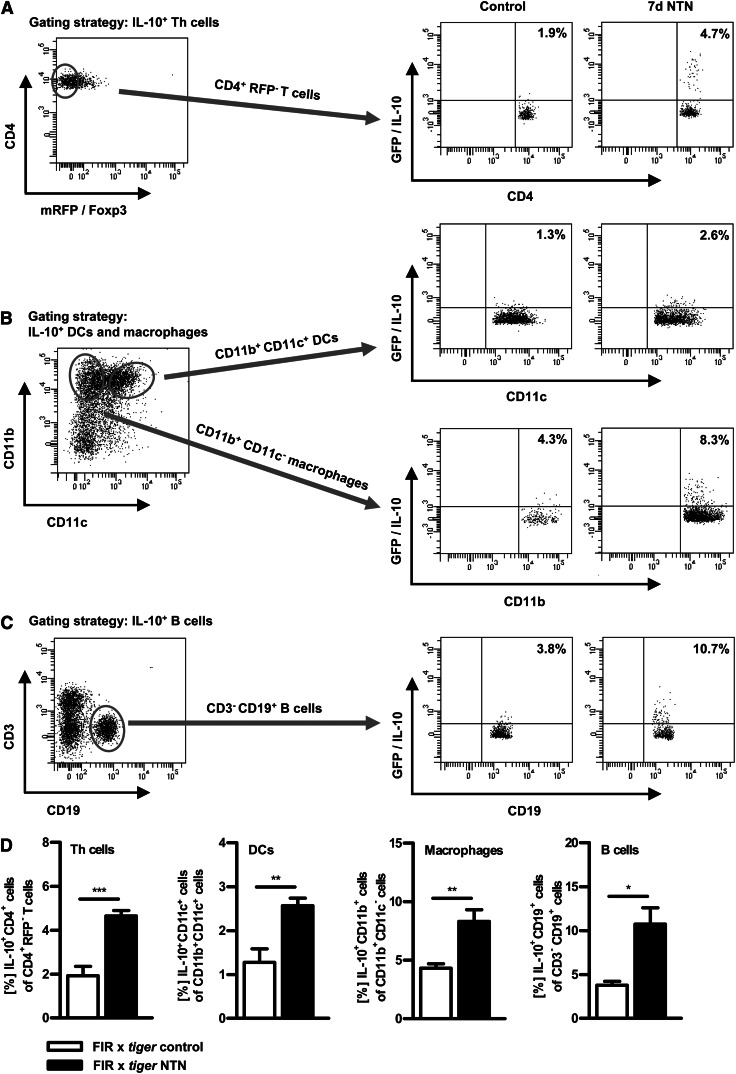
IL-10-producing T cells, B cells, DCs and macrophages infiltrate the inflamed kidney. Renal single cell suspensions from non-nephritic and nephritic IL-10 reporter (FIR x tiger) mice were prepared and analyzed by flow cytometry 7 days after NTN induction. Cells were gated on the appropriate cell surface markers for (A) Th cells (CD4+RFP−), (B) DCs (CD11b+CD11c+), (B) macrophages (CD11b+CD11c−), and (C) B cells (CD3−CD19+) and further analyzed for GFP (IL-10) expression. Representative dot plots are depicted. Numbers represent events in quadrants in percentage of all gated events. (D) Quantification of renal IL-10–producing cells (*P<0.05, **P<0.01, ***P<0.0001). Error bars represent standard error of the mean (SEM).

