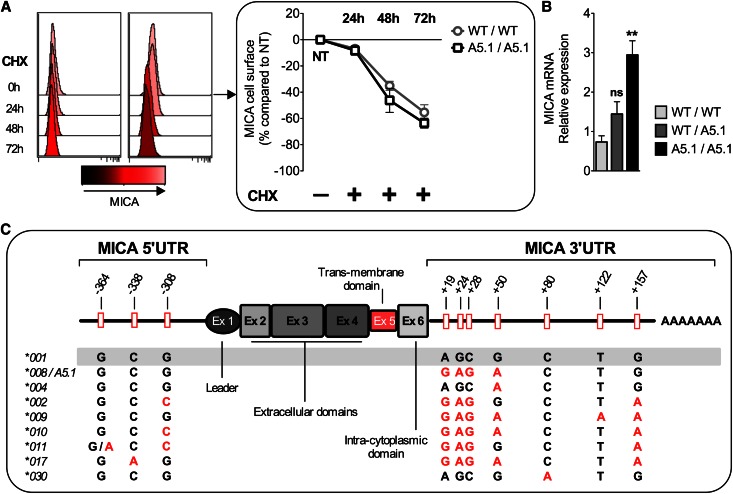
Figure 4.
MICA A5.1 overexpression is not due to increased protein stability but results from a transcriptional control. (A) ECs with WT/WT (n=3) or A5.1/A5.1 (n=6) MICA genotypes were treated by cycloheximide (CHX), and MICA expression was analyzed by flow cytometry at different time points. Representative histograms from individual donors (left) and a quantitative analysis (right) are shown. Decrease in parallel kinetics of membrane-bound MICA was observed by FACS. (B) MICA transcripts in ECs were quantified by quantitative PCR, and results from WT/WT (n=6), WT/A5.1 (n=4) and MICA A5.1/A5.1 (n=4) are expressed as relative expression calculated by the 2−ΔΔCt method (**P<0.01). (C) Location and allele-specificity of the SNPs identified by sequencing the 5′UTR and 3′UTR regions from 34 EC cultures, including alleles MICA*008(A5.1), *004, *002, *009, *010, *011, *017, and *030.

