Figure 2.
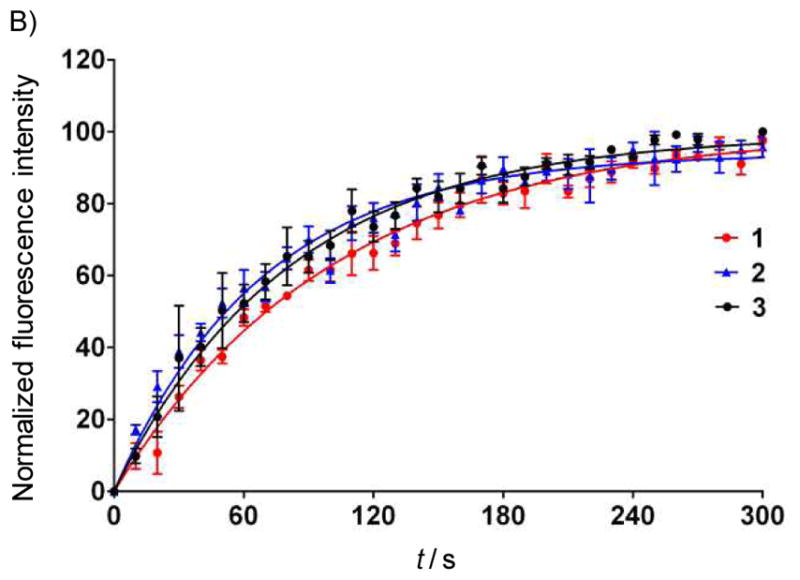
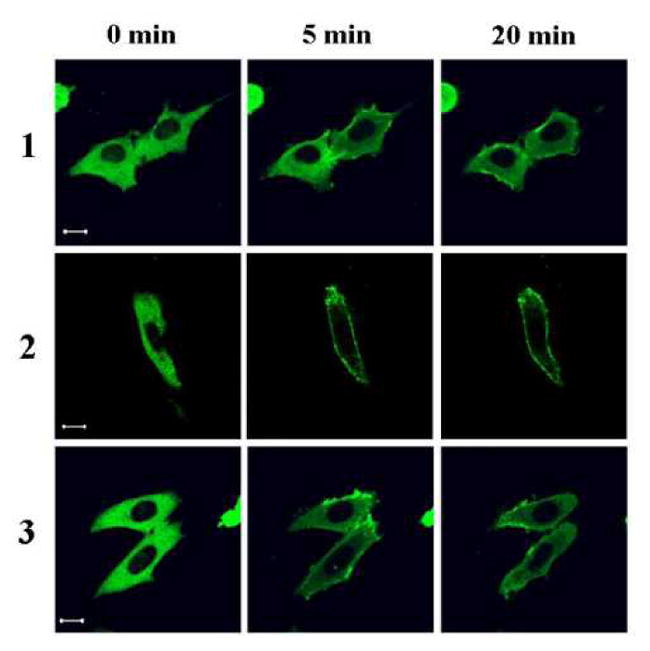
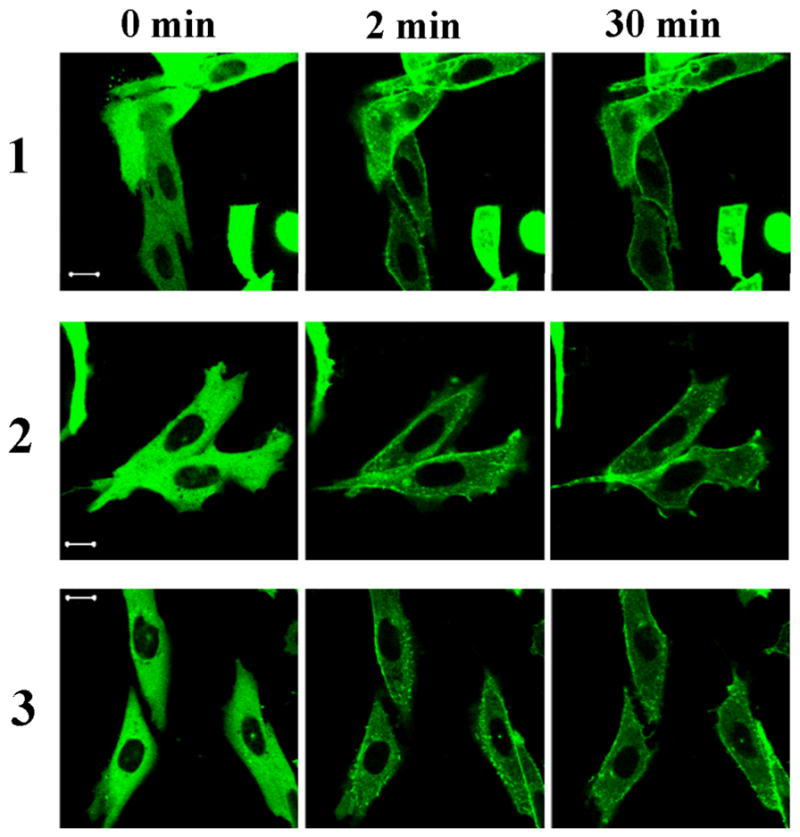
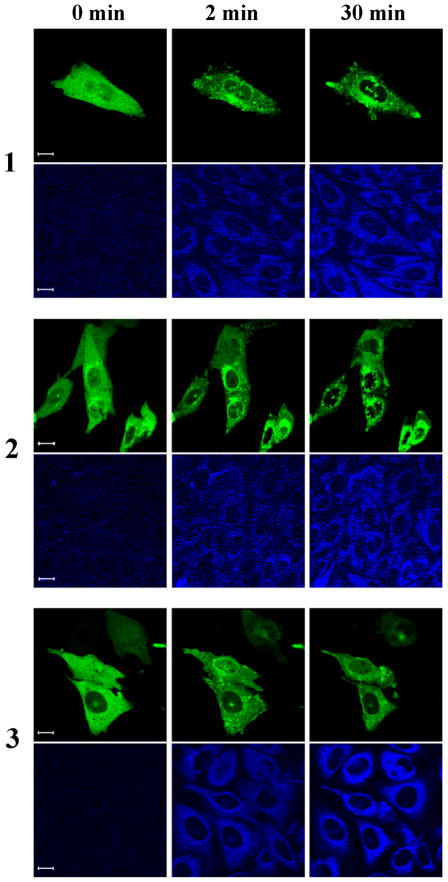
Figure 2A: Translocation of GFP-PKC delta in CHO cells. CHO cells transfected with GFP-PKC delta were treated with 10 μM of the compounds. Following treatment, images were captured every 30 seconds by confocal microscopy at two different channels: GFP (upper panel) and UV (lower panel)(this latter channel visualizes the DAG-indololactone). The contrast and intensity of UV images were optimized for better visualization using Adobe Photoshop CS3. Images are representative of three independent experiments for each compound. Scale bars, 10 μm.
Figure 2B: Rate of DAG-indololactone uptake into CHO cells. CHO cells were treated with 10 μM of the compounds and images were captured by confocal microscopy every 10 seconds after treatment. Fluorescence intensities normalized to maximal response from multiple independent experiments (n>4) were fitted to a one phase exponential association curve to calculate T1/2.
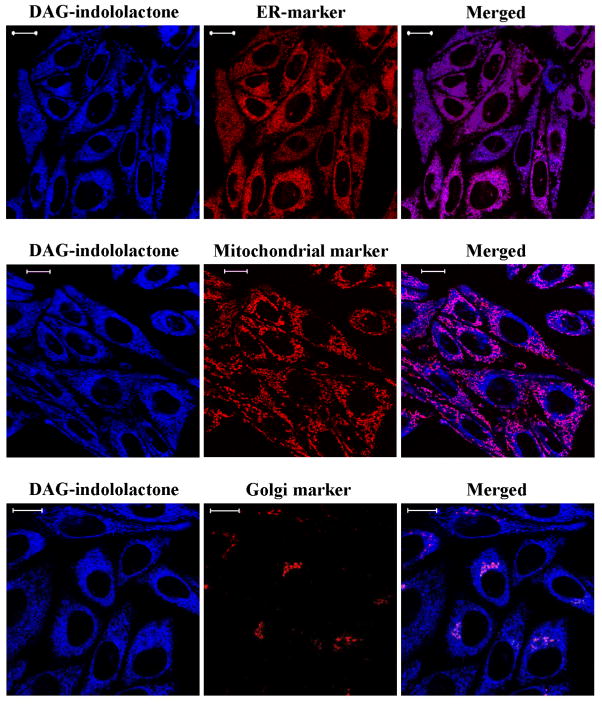
Figure 2C: Colocalization of DAG-indololactone 3 with different organelle markers. CHO cells loaded with endoplasmatic reticulum- (ER Tracker Red), mitochondrial- (MitoTracker Red CMXRos) or Golgi markers (BODIPY FL C5-ceramide) were treated with 10 μM compound 3 for 10 min. Z-stack images were captured by confocal microscopy. Images represent optimal sections from three independent experiments. Scale bars, 10 μm.
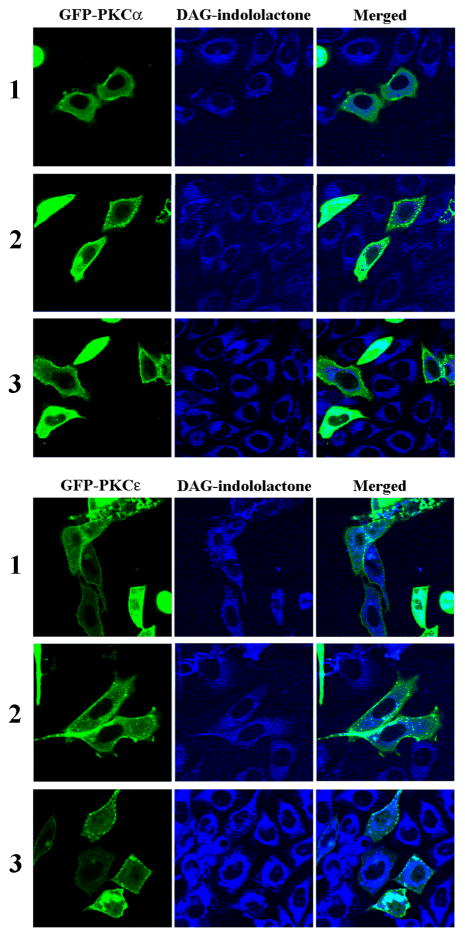
Figure 2D: Translocation of GFP-PKC alpha in CHO cells. CHO cells transfected with GFP-PKC alpha were treated with 10 μM of the compounds and images were captured by confocal microscopy every 30 seconds after treatment. Representative images from three independent experiments are shown. Scale bars, 10 μm.
Figure 2E: Translocation of GFP-PKC epsilon in CHO cells. CHO cells transfected with GFP-PKC epsilon were treated with 10 μM of the compounds and images were captured by confocal microscopy every 30 seconds after treatment. Images are representative of three independent experiments for each compound. Scale bars, 10 μm.
Figure 2F: Translocation of GFP-PKC alpha and PKC-epsilon in CHO cells. At the end of the PKC alpha (upper panel) and PKC epsilon (lower panel) translocation experiments (35 min) images were taken at two different channels: GFP and UV (this latter channel visualizes the DAG-indololactone). Separate and merged images are shown. The contrast and intensity on UV images were optimized for better visualization using Adobe Photoshop CS3. Images are representative of three independent experiments.

