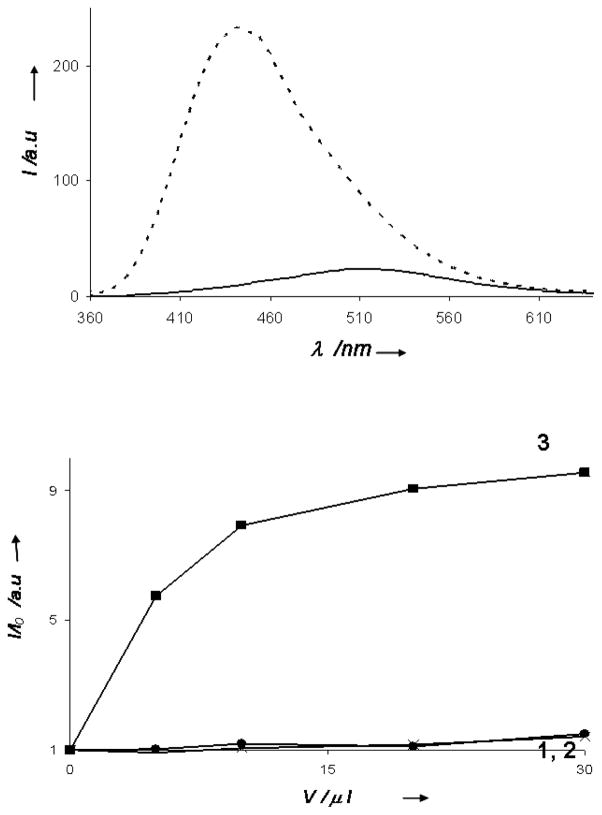
Figure 3. Modulation of fluorescence intensity of DAG-indololactones following interaction with giant lipid vesicles.
A. Fluorescence emission spectra (excitation 330 nm) of 3 in buffer (solid spectra) and in giant vesicle solutions (broken spectra); B. Dose response curves depicting the ratios of fluorescence emission recorded in solutions of giant vesicles and in buffer, respectively.

