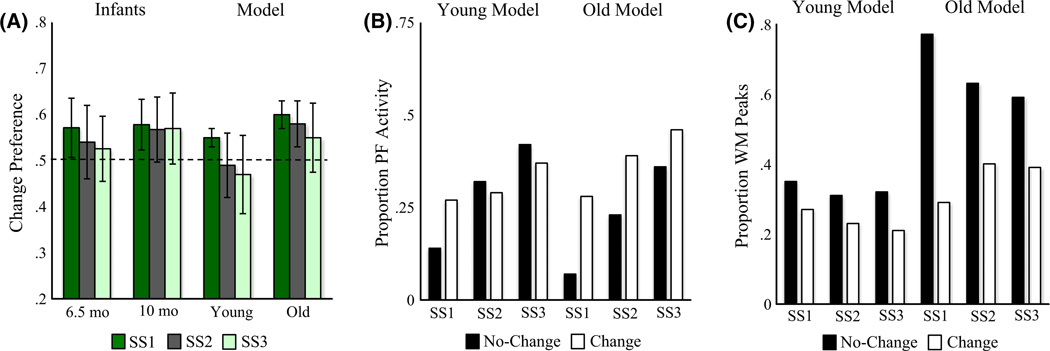
Figure 4.
Results of Simulation Experiment 1. (A) Change preference scores for infants in Ross-Sheehy et al. (2003) Experiment 1 and our DNF model (error bars show one standard deviation). The x-axis shows the age of infants or developmental stage of the model, the y-axis shows change preference scores (chance = 0.50), and bars represent different set sizes. (B) The proportion of time strong activation (> .5) from PF is feeding into the fixation system while looking at the change (white bars) and no-change (black bars) displays relative to total looking across both displays, averaged across simulations. The x-axis shows set sizes separately for the young versus old model. (C) The proportion of WM peaks maintaining items across delays for the change (white bars) and no-change (black bars) displays, averaged across simulations. The x-axis shows set sizes separately for the young versus old model. Note that the maximum number of items that can be maintained for the no-change display is equal to the set size. As set size increases, the same proportion of items maintained in WM reflects a higher number of items. The maximum number of unique items that can be maintained for the change display is on average slightly less than the set size because, on each "blink", colors were randomly selected from a set of nine. Occasionally, one or more items present on the change display were also on the no-change, which were not included when calculating the number of items maintained for the change display.

