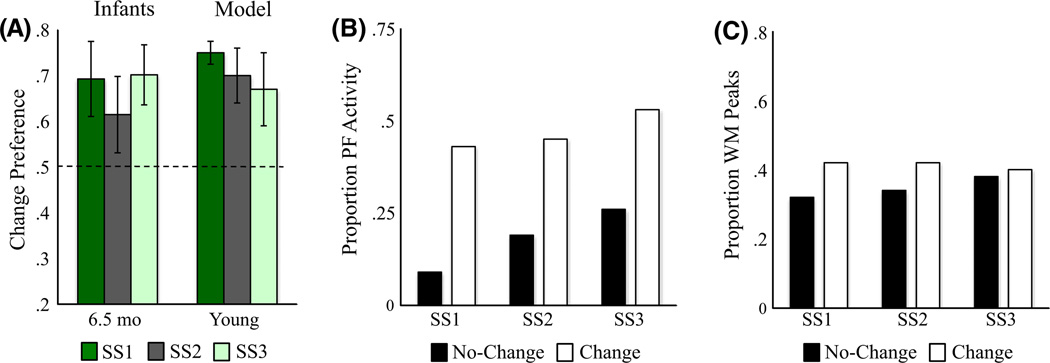
Figure 5.
Results of Simulation Experiment 2. Panels are the same as in Figure 4. Note that the proportion of WM peaks across SS1–3 for the no-change display is comparable to the proportion of WM peaks for the no-change display across SS1–3 in Simulation Experiment 1 for the same young infant model. However, the proportion of WM peaks for the change display increased, due both to the absence of a delay and a small bias to look at the change display (see text for additional details).

