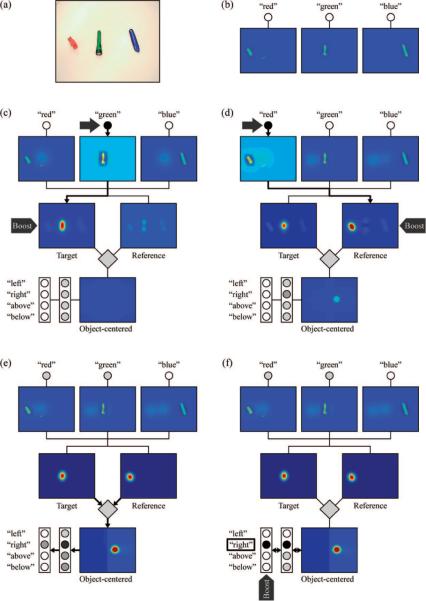
Figure 4.
Activation sequence for spatial term selection in Demonstration 1. Panel (a) shows the camera input for this task. Panels (b)–(f) show activity distributions at different points in the task. Field activity levels are color-coded (dark blue = lowest activity, dark red = highest activity). Activity of discrete nodes (circles) is coded by lightness (darker shades = higher activity). The activity in the high-dimensional transformation field (grey rhombus) is not represented. Bold connections with arrows between the fields highlight dominant directions of information flow in the task. Block arrows indicate current task input. Panel (b): the scene representation in the color-space fields before the task. Panel (c): target object selection by activating the green color node and boosting the target field. Panel (d): reference object selection by activating the red color node and boosting the reference field. Panel (e): emergence of a peak in the object-centered field representing the target object location relative to the selected reference object. The right spatial relation node activity is also increased (dark gray node). Panel (f): boost of spatial term nodes to prompt the response right (box).

