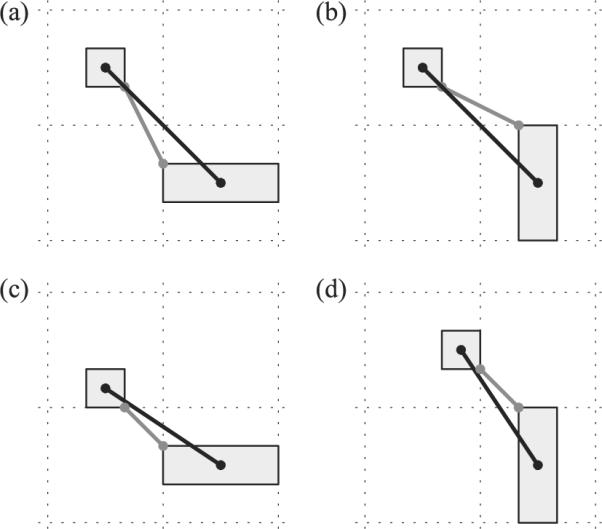
Figure 6.

Proximal orientation vectors (gray lines) and center-of-mass orientation vectors (black lines). Panels (a) and (b) depict a change in the proximal orientation vector from the Wide (a) to the Tall (b) reference object condition as in Demonstration 2a, while the center-of-mass orientation remains the same. Panels (c) and (d) depict a change in the center-of-mass orientation vector from the Wide (c) to the Tall (d) reference object condition while the proximal orientation is held constant, corresponding to the situation in Demonstration 2b.
