
Figure 4.
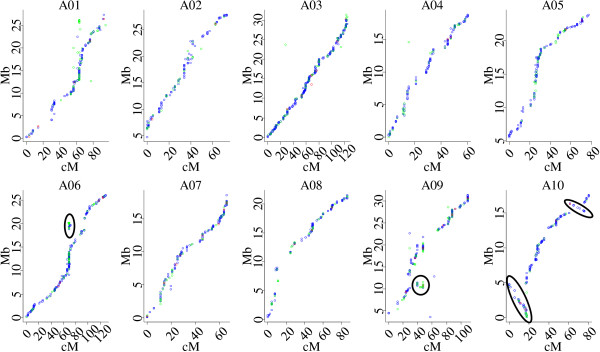
Alignments between the SNP linkage map and the B. rapa reference genome sequence. The X axis represents the genetic distance of each A genome linkage group in B. napus, and the Y axis represents the physical distance of reference sequence of each corresponding B. rapa chromosome. The green points represent the best hit (E value < =1e-10) of multiple paralogous loci in the B. rapa genome. The red points represent loci with only one end of the PE read having a unique position in the B. rapa genome. The blue points represent loci with both ends of the PE read having a unique position in the B. rapa genome. The oval circles indicate SNP loci that detected blocks of misassembly in the B. rapa reference genome sequence.