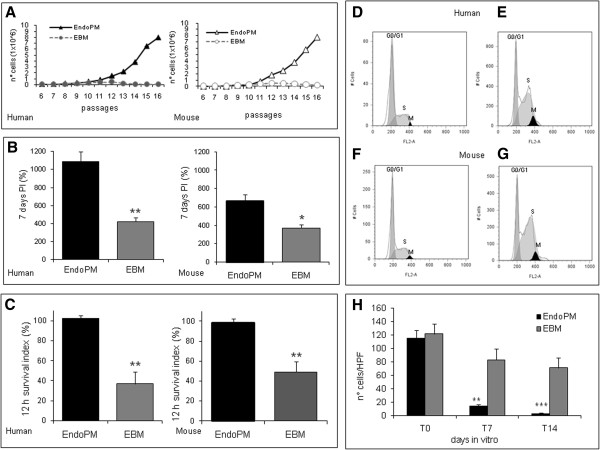
Figure 1.
Culture characteristics of human and murine BMVECs. A) Growth curve of human and mouse BMVECs cultured in EndoPM (black line) or complete EBM (gray lines); B) proliferation index of human and mouse BMVECs cultured in EndoPM (black bars) or EBM (gray bars) at 7 DIV; C) survival index of human and mouse BMVECs cultured in EndoPM (black bars) or EBM (gray bars) 12 hours after culture; D-G) cell cycle profiles of human and mouse BMVEC growth in EBM (D, F) or EndoPM (E, G). Histograms are representative of one of four independent experiments. H) Co-culture of NHDF and BMVECs in EndoPM (black bars) or EBM (gray bars) after 0, 7 and 14 days of culture. Bars represent the number of CFDA-SE positive cells (NHDF) per field (Higer power field - HPF). * P < 0.05; **P < 0.01; ***P < 0.001.

