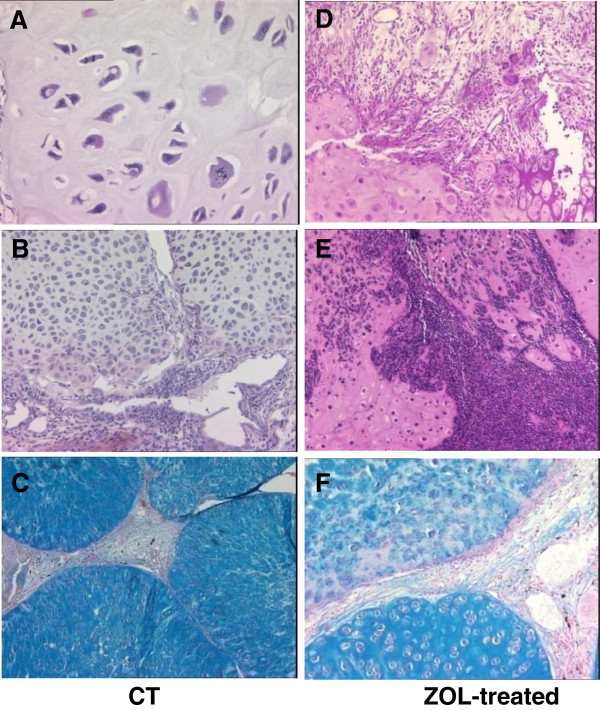
Figure 2.
Histological analysis of tumor tissue at the end of the study: control (A to C) and ZOL-treated (D to F) groups. The tumor slices were stained with hematoxylin-eosin (A, B, D, E) or with alcian blue (C, F). Magnification: ×50 (C), ×100 (B, D, E, F), and ×200 (A). CT, controls; ZOL, zoledronic acid.

