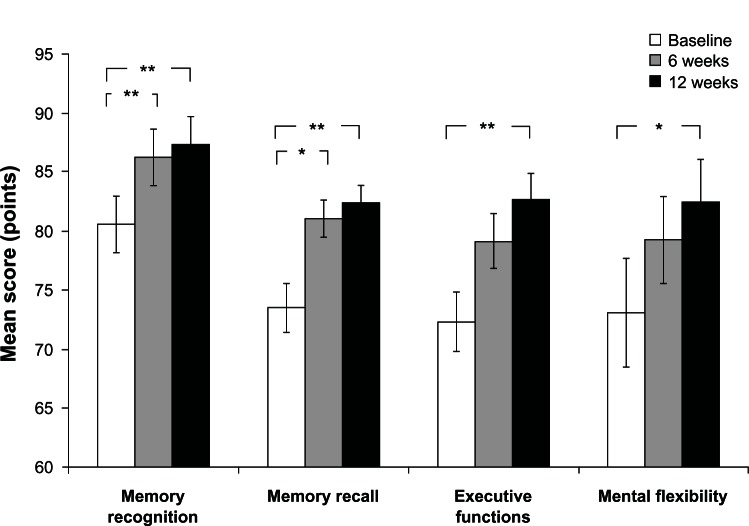
Figure 1.
The effect of SB-PS on subjects’ performance in the cognitive computerized tool.
Notes: RM-ANOVA was initially used to test the changes in the cognitive composite scores over the treatment period (results are shown in Table 1). Then, Student’s t-test comparison for dependent samples was applied on the parameters that were found to be statistically significant in the RM-ANOVA analysis. The figure demonstrates the mean ± SE scores at baseline and 6 and 12 treatment weeks and statistical significance as analyzed using Student’s t-test. *P ≤ 0.01; **P ≤ 0.006; n = 25.
Abbreviations: RM-ANOVA, repeated measures analysis of variance; SB-PS, soybean-derived phosphatidylserine; SE, standard error.

