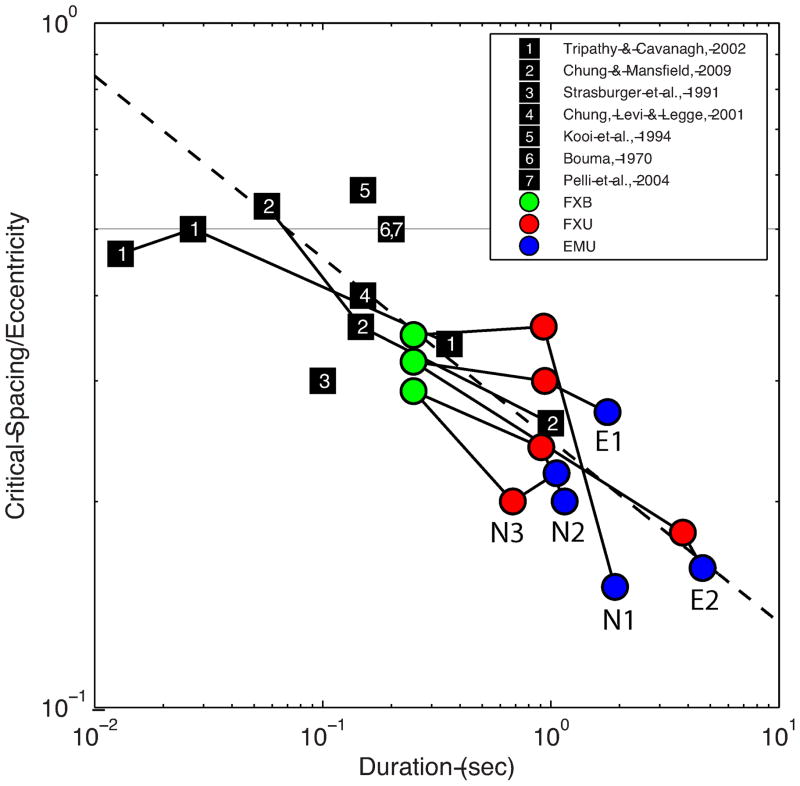
Figure 10.
Plot of eccentricity-normalized critical spacing as a function of stimulus duration, over a representative set of studies using letters and numerals as stimuli. Previous studies are plotted as numbered squares, the current data is plotted as colored symbols: FXB (green), FXU (red), EMU (blue). The horizontal gray line represents a ratio of 0.5 times the eccentricity ie. Bouma’s ‘Law’. The solid lines connect data across durations for the same observers (present study with observers identified) or same study (prior studies). The dotted line represents a power law fit to the data, weighted by number of observers of each study. The estimated exponent is −0.27, meaning that over 13-fold increase in stimulus duration is required to reduce critical space by one half.

