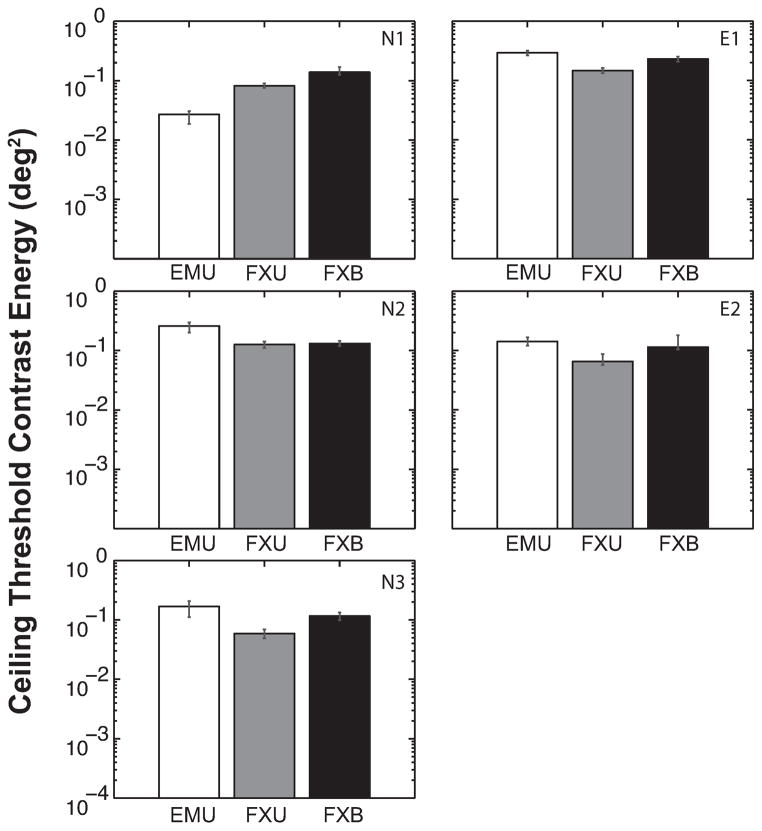
Figure 6.
Ceiling contrast energy threshold estimated for each viewing condition and observer. Error bars represent the bootstrapped 95% confidence interval. Ceiling threshold represents the maximum effect of flankers on letter identification was consistently and significantly lower for FXU than FXB [t(4) = 4.187, p = 0.014] but not significantly different for the EMU versus FXU comparison [t(4) = 0.016, p = 0.988].

