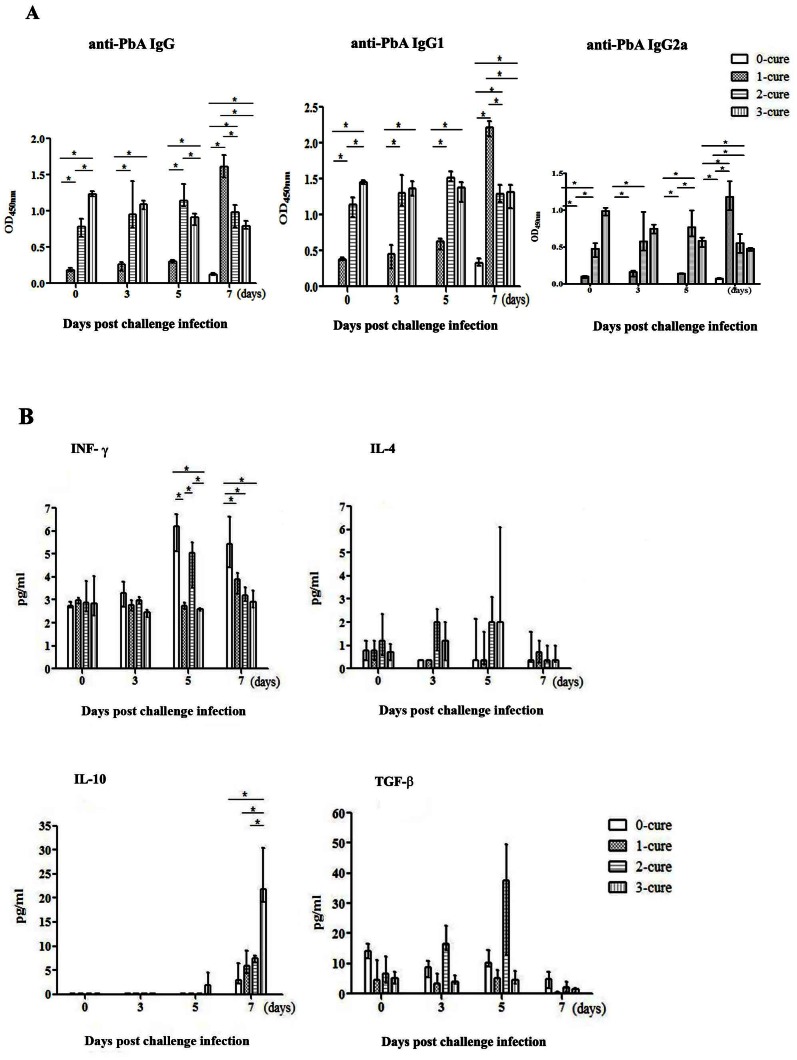
Figure 3. Persistent parasite-specific antibodies and sharp increase of IL-10 production on day 7 PI in 3-cure.
Plasma antibodies and cytokines were quantified on day 0, 3, 5, and 7 post challenge infection (PI). On each of indicated days PI, four mice in each group were sacrificed to harvest sera for antibody and cytokine quantitation. Bar chart represents the median antibody and cytokine levels (n = 4 on each group) with the error bars indicate the interquartile range (lower bar: 25th percentile, upper bar: 75th percentile). (A) IgG, IgG1, IgG2a; (B) IFN-γ, IL-4, IL-10 and TGF-β levels in plasma during the first week of infection. Data presented are pooled from two separate experiments. Statistical analysis was by Mann-Whitney U test comparing the differences on the indicated days PI between 0-cure and each of 1-cure, 2-cure and 3-cure mice where *, p<0.05.

