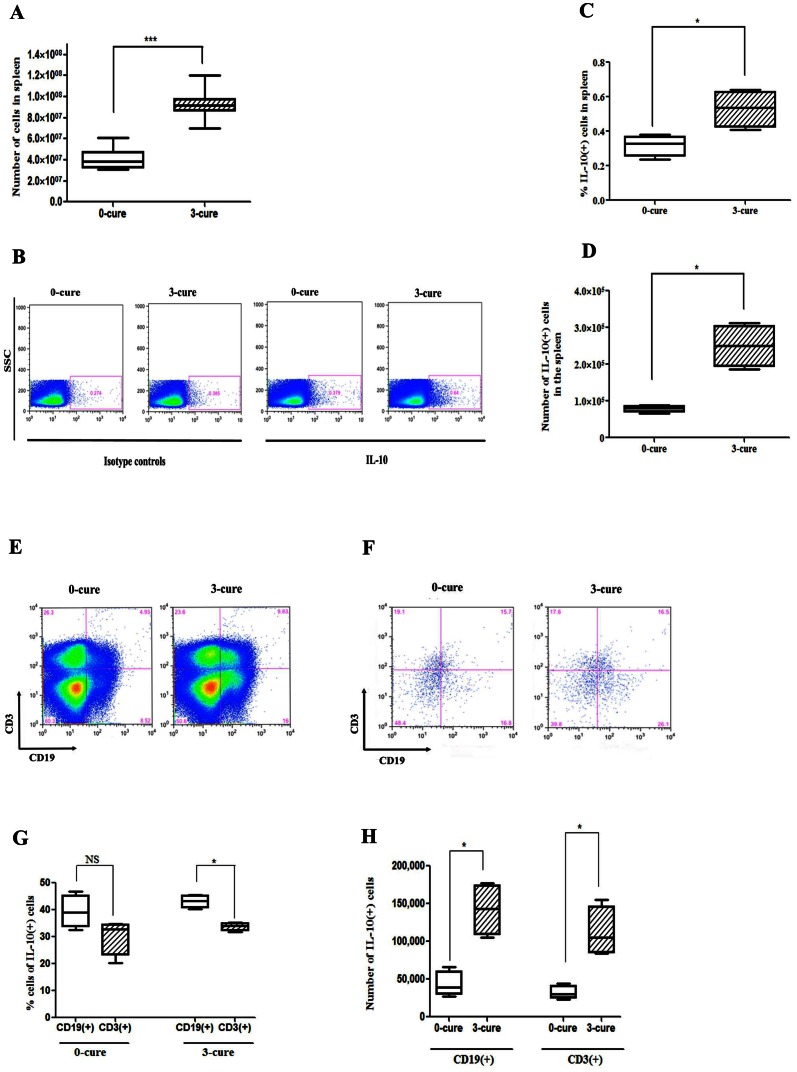
Figure 4. CD19(+) cells are the major source of IL-10.
Spleen cells from infected B6 mice were harvested and stimulated for 5 hours in culture with pRBC, LPS, PMA, ionomycine and monensin, which was followed by IL-10 intracellular staining and analyzed by flow cytometric analysis. (A) Bar chart shows the median number of splenocytes (± interquartile range) (n = 10). (B) Representative dot plots for one mouse of each group showing frequencies of IL-10 producing cells in spleen. (C, D) Bar charts indicate the median (± interquartile range) percentages and numbers of cells that produced IL-10 (n = 4). (E, F) Representative dot plots for one mouse of each group showing the proportion of CD19(+) and CD3(+) cells before and after gating for IL-10(+) cells. (G, H) Bar charts represent median (± interquartile range) percentages (G) and numbers (H) of CD19(+)IL-10(+) and CD3(+)IL-10(+) in IL10(+) cells in spleen. All results represent two independent experiments with four mice in each group. Significant differences between sample medians are indicated; *, p<0.05; ***, p<0.001; NS, non-significant by Mann-Whitney U test.

