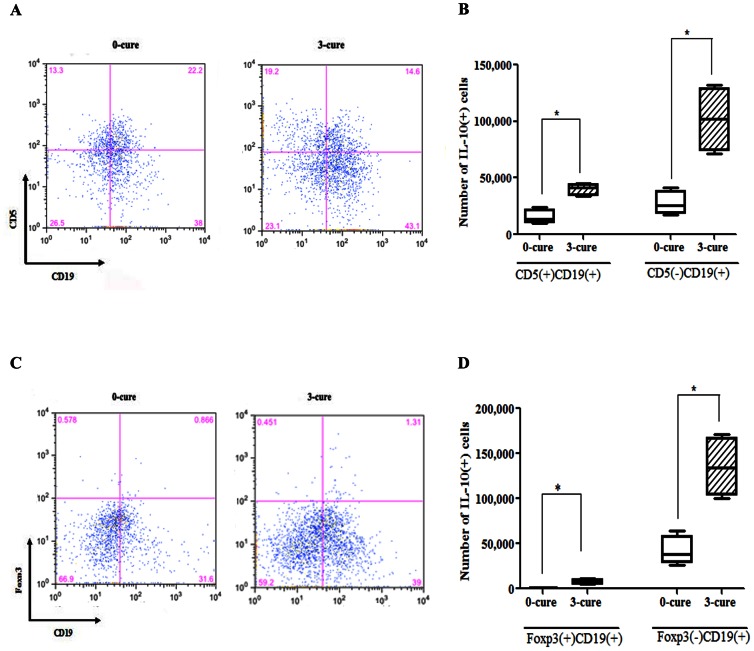
Figure 5. B cell subset CD5(−)CD19(+) (B1b) predominantly produces IL-10.
Splenocytes from day 7 PI 0- and 3-cure mice were cultured with pRBC, LPS, PMA, ionomycin, and monensin for 5 hours before permeabilization and staining with CD5, CD19, Foxp3 and IL-10 mAbs and analyzed by flow cytometric analysis. (A, C) Representative dot plots for a mouse from each group show the frequencies of CD5(A) and Foxp3(C) expression in IL-10 producing CD19(+) cells. (B, D) Bar graphs indicate the median (± interquartile range) numbers of CD5(+), CD5(−) cells (B) and Foxp3(+), Foxp3(−) cells (D) in IL-10 producing CD19(+) cells. All results are from two independent experiments with four mice in each group. Significant differences between sample medians are indicated; *, p<0.05, by Mann-Whitney U test.

