
Figure 5.
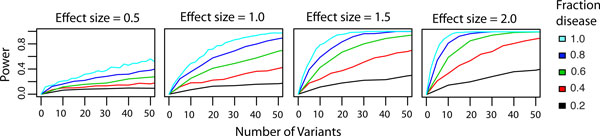
Sensitivity of gene score to mutation count and fraction of functional mutations at different effect sizes. Power to detect disease genes was estimated using simulations in R. Mutation counts and fraction of functional mutations were varied at four different effect sizes (0.5, 1.0, 1.5 and 2.0). A distinct plot represents the results of the simulation for each effect size. The legend on the top right shows the fraction of disease mutations simulated in each gene.