
Figure 6.
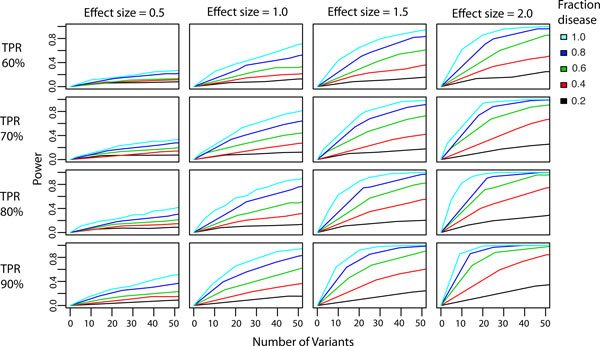
Sensitivity of gene score to VEST classification error. Power simulations were repeated with an additional parameter: VEST true positive rate (TPR). Four TPRs were selected based on VEST generalization error estimates. A set of simulation is shown for each of the four points (60%, 70%, 80% and 90%). As expected, power to detect disease genes decreases as the TPR decreases.