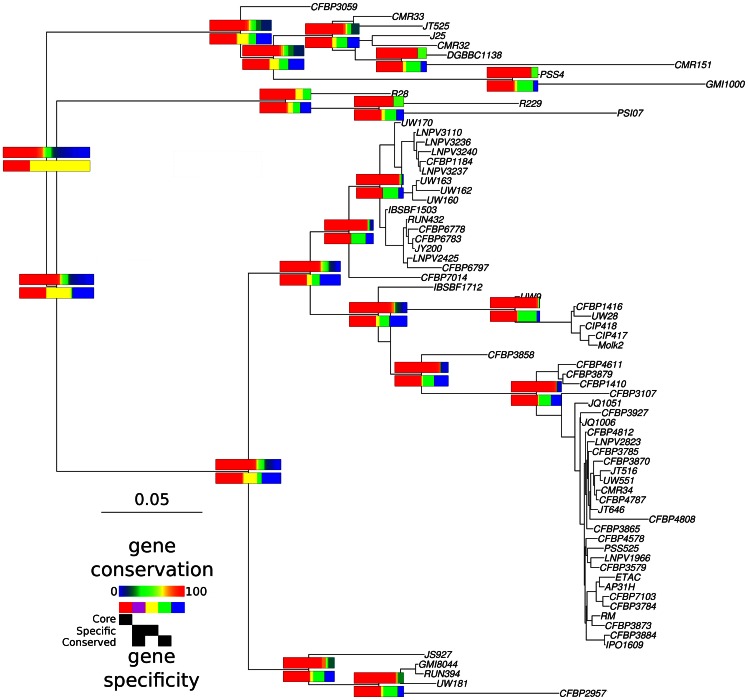
Figure 3. Gene conservation and specificity.
Schematic representation of gene conservation and specificity along the phylogeny of the R. solanacearum species complex. Only gene content at nodes prior to major splits in the phylogeny are represented. Upper rectangles indicate the degree of gene conservation in the strain to the right of the node with the degree of gene conservation varying from conserved (red) to rare (blue). Lower rectangles indicate the degree of gene conservation in the strain on the right of the node. Red tracks correspond to the proportion of genes from the core genome (conserved in every strain). Purple tracks correspond to specific genes conserved, while yellow tracks indicate specific genes that are not conserved. Non-specific genes are indicated with green (conserved) and blue (not conserved) tracks. The relative length of the rectangles is proportional to the number of genes present in the strains to which they refer.

