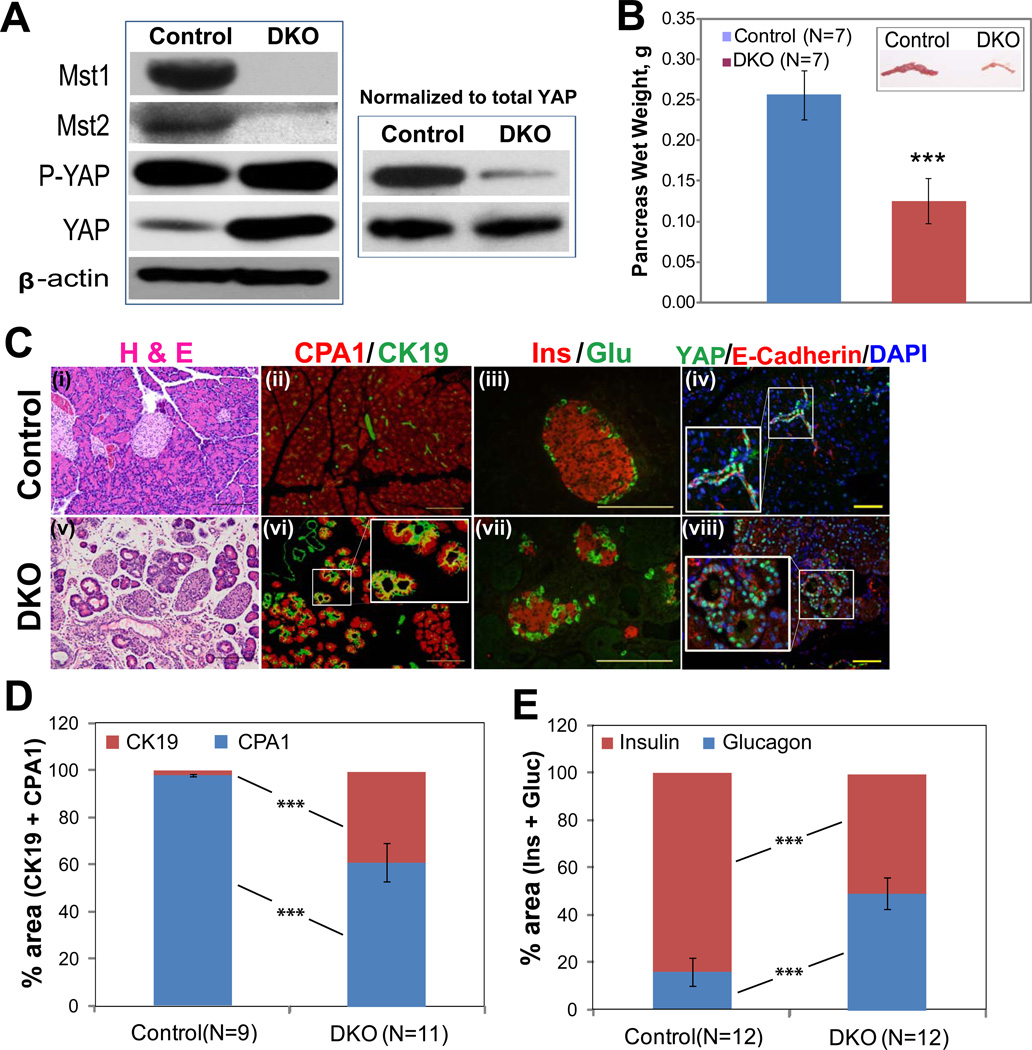
Figure 1. Pancreatic deletion of Mst1 and Mst2 results in increased nuclear YAP, decreased pancreas size, and altered pancreatic architecture.
(A) Western blot showing the relative abundance of Mst1, Mst2, phospho-YAP (P-YAP), and total YAP in protein extracts from 1-month-old control (Pdx1-Cre; Mst1+/−, Mst2fl/+) or DKO pancreas (Pdx1-Cre; Mst1−/−; Mst2fl/fl). In the left-hand panel, 30 µg of total protein was loaded in each lane; in the right-hand panel, loading was adjusted so an equal amount of total YAP was loaded to each lane. Blots are representative of three independent experiments.
(B) Bar graph showing pancreas weight from control and DKO animals (mean +/− SD; **, P<0.01). Inset: photograph of control and DKO pancreata.
(C) H&E and immuno-staining of control and DKO pancreata with cytokeratin 19 (CK19), carboxypeptidase A1 (CPA1), insulin (Ins), glucagon (Glu) and YAP shows a disruption of pancreatic architecture and cell types in DKO pancreas and an increased abundance of cells exhibiting nuclear YAP staining.
(D, E) Quantification of changes in relative percentage of acinar/ductal area (D; measured by CPA1 and CK19 staining) and α/β area (E; measured by insulin and glucagon staining) in control versus DKO pancreata (mean +/− SD; ***, P<0.001). Scale: 100 µM.

