Figure 3.
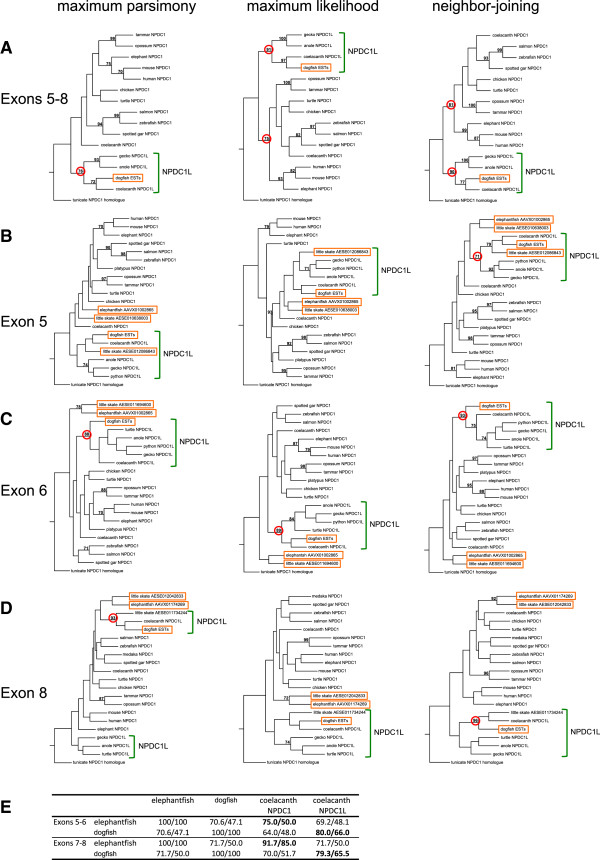
Phylogenetic analysis of NPDC1/NPDC1L homologs in gnathostomes. (A-D) Phenograms of phylogenetic analyses alignments of translated sequences of NPDC1, NPDC1L and chondrichthyan sequences analyzed by maximum parsimony, maximum likelihood and neighbor-joining methods, using a tunicate NPDC1/NPDC1L homolog as an outgroup. Alignments are presented in Additional file 2. Only significant bootstrap values (>70%) are shown and those relevant to the text are circled in red. Chondrichthyan sequences are boxed. NPDC1L sequences, including putative chondrichthyan orthologs, are bracketed. (E) Percentage of similarity/identity values comparing translated elephantfish and dogfish sequences to each other and to coelacanth NPDC1 and NPDC1L. The percentages highlighted in bold show that the elephantfish sequences are most similar to coelacanth NPDC1 while the dogfish sequence is most similar to coelacanth NPDC1L, indicating respective orthology when combined with the phenogram data.

