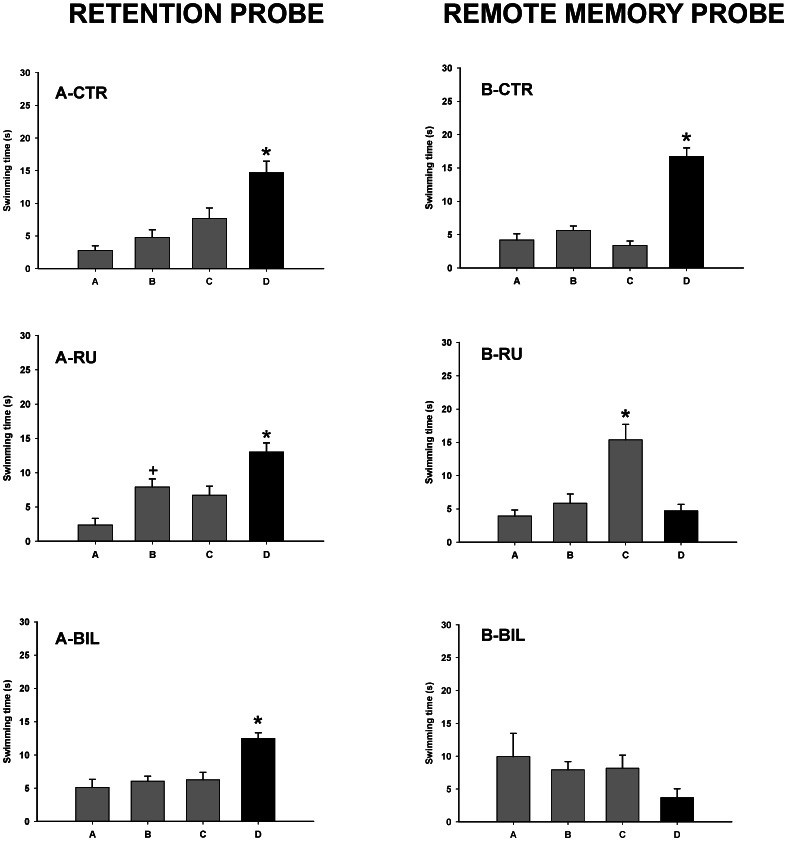
Figure 2. Retention probe and remote memory probe.
Mean time spent in the different quadrants during retention probe (left column) and after TTX injection (remote memory probe, right column) in the different experimental groups. Bars represent mean swim latencies in the different quadrants of the water maze during the probes. D = target quadrant, C = opposite, A = counter-clockwise, B = clockwise. *p<0.01, significantly different as compared to the rest of quadrants, + p<0.05, significantly different as compared to quadrant A. CTR: control, RU: right, and BIL: bilateral groups.

