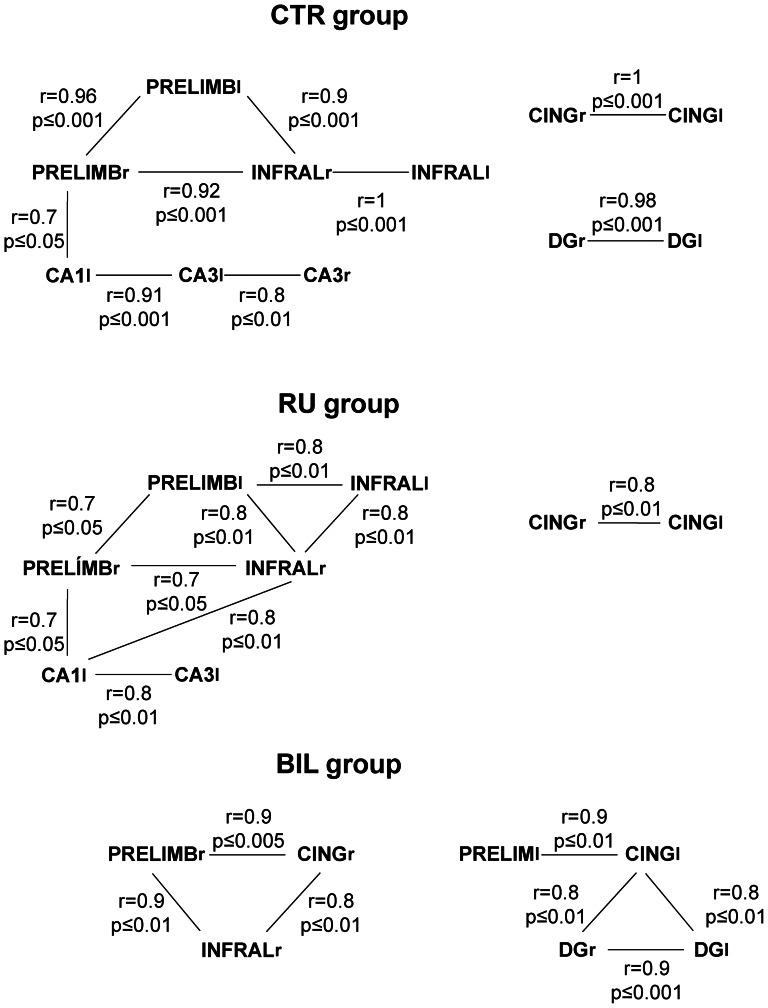
Figure 3. Interregional within-group correlations of CO activity.
Schematic diagram showing significant correlations in CO activity among right (R) or left (l) between hippocampal and prefrontal regions calculated for the different experimental groups. Abbreviations: prelimbic (PRL) and infralimbic (IL) cortex, cingulate cortex (CG), hippocampal dentate gyrus (DG) and subfields (CA1 and CA3).

