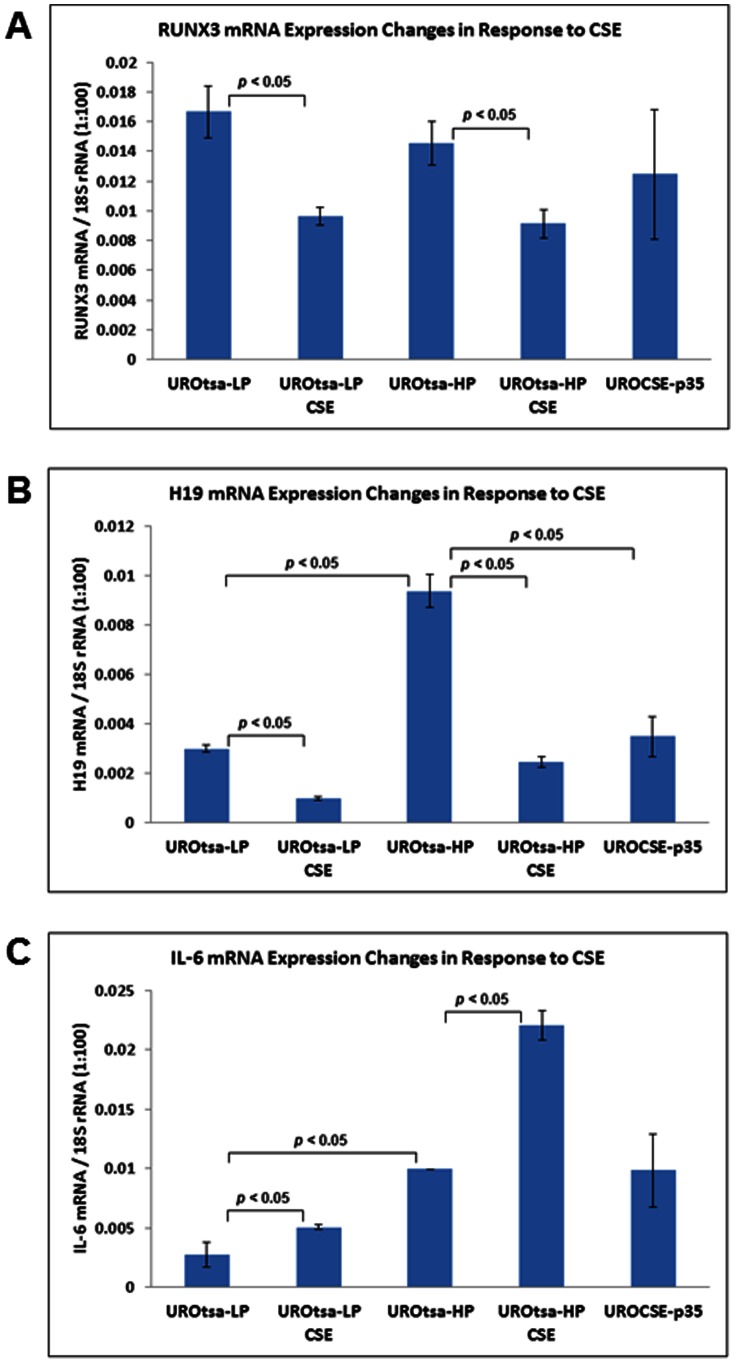
Figure 4. Expression changes of genes presenting CSE-induced hypomethylation in the CSE-treated UROtsa cells.
A. RUNX3 mRNA expression in UROtsa cells transiently or chronically treated with CSE. Data represent RUNX3 mRNA copy numbers relative to 1/100 of the 18S rRNA copy number, determined as the mean of three independent experiments with standard errors shown by the error bars. UROtsa-LP: UROtsa cells cultured in CSE-free medium, 8th passage; UROtsa-LP CSE: UROtsa-LP cells treated for 1 day with CSE. UROtsa-HP: UROtsa cells cultured in CSE-free medium, 34th passage; UROtsa-HP CSE: UROtsa-HP cells treated for 1 day with CSE. UROCSE-p35: UROtsa cells chronically treated with CSE, 35th passage. Statistically significant differences between the datum columns are as indicated in the figure (n = 3, p<0.05). B. H19 mRNA expression in UROtsa cells transiently or chronically treated with CSE. Statistically significant differences between the datum columns are as indicated in the figure (n = 3, p<0.05). C. IL-6 mRNA expression in UROtsa cells transiently or chronically treated with CSE. Statistically significant differences between the datum columns are as indicated in the figure (n = 3, p<0.05).

