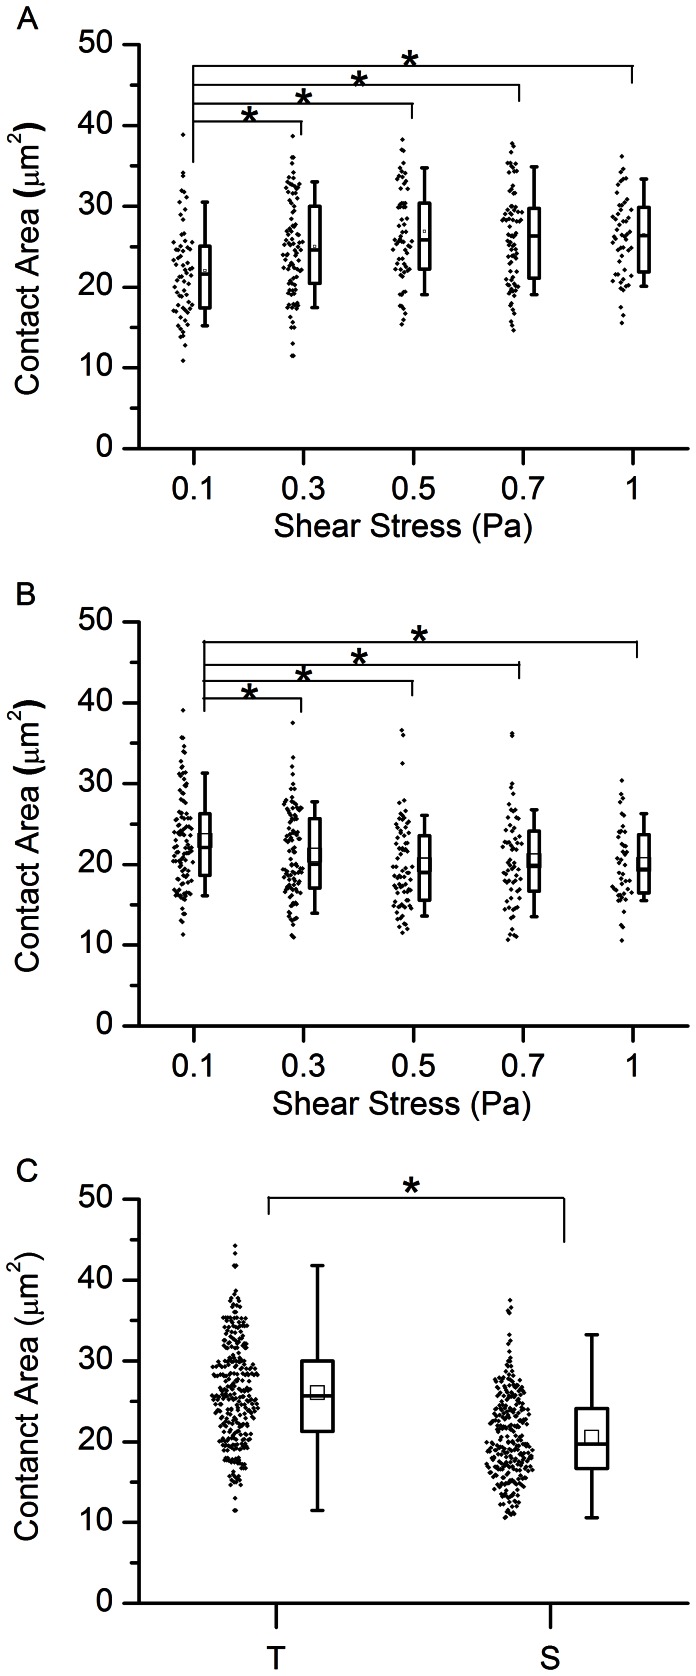
Figure 5. Measurements of contact area of iRBCs flowing through CD36 coated channel using TIRF.
(A) Box plot of the contact area of iRBCs at the trophozoite stage flowing through the CD36 coated channel at different shear stresses. The bottom and top of the box denote the 25th and 75th percentiles of the population, respectively, while the bottom and top whiskers denote 10th and 90th percentiles, respectively. (B) The same as that in panel A only for iRBCs at the schizont stage. There is no significant difference among groups, where shear stress larger than 0.3 Pa. (C) The same as in panel A for contact area of iRBC at the trophozoite stage and the schizont stage at shear stress larger than 0.3 Pa. *indicates significant difference at p<0.05.

